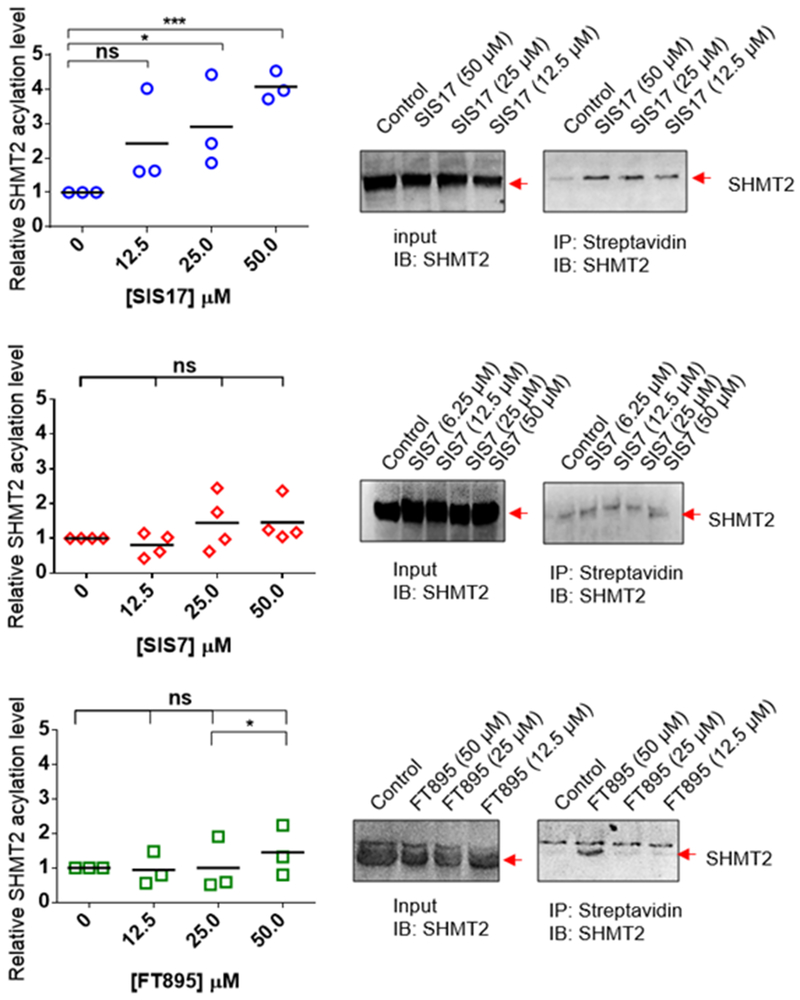
Figure 3.
Endogenous fatty acylation levels of SHMT2 in MCF7 cells treated with 12.5, 25.0 and 50.0 μM of SIS7, SIS17 and FT895. Representative Western blot images are shown. Signal intensity was quantified by ImageJ and signal of control group without inhibitor treatment set as 1.0. *, p value < 0.1, **, p value < 0.05, ***, p value < 0.01; ns, not statistically significant.

