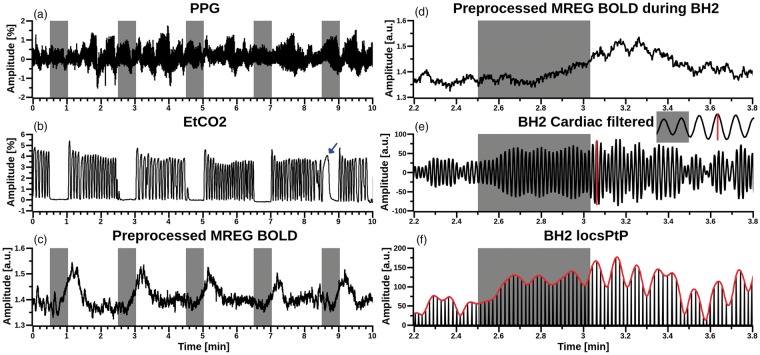
Figure 1.
Multimodal data from one arbitrarily selected subject, with grey bars indicating subsequent BHs. (a) Aestiva/5 continuous fingertip PPG pulsations, (b) Aestiva/5 monitor etCO2 signal for respiration from nasal cannula. For this subject, BH5 was excluded due to spontaneous inhalation (marked with blue arrow). (c) Amplitude of preprocessed MREG BOLD signal from anterior cingulate cortex (x = −6 mm, y = 39 mm, z = 0 mm, 4 mm spherical ROI in MNI space). (d) Magnified view of preprocessed MREG BOLD signal during BH2. (e) Band-pass filtered cardiovascular MREG signal during BH2. Inlay depicts a single pulse amplitude peak-to-peak (red vertical line) calculation. (f) Red envelope curve of cardiovascular pulse amplitude peak to peak (PtP) signal derived from (e).

