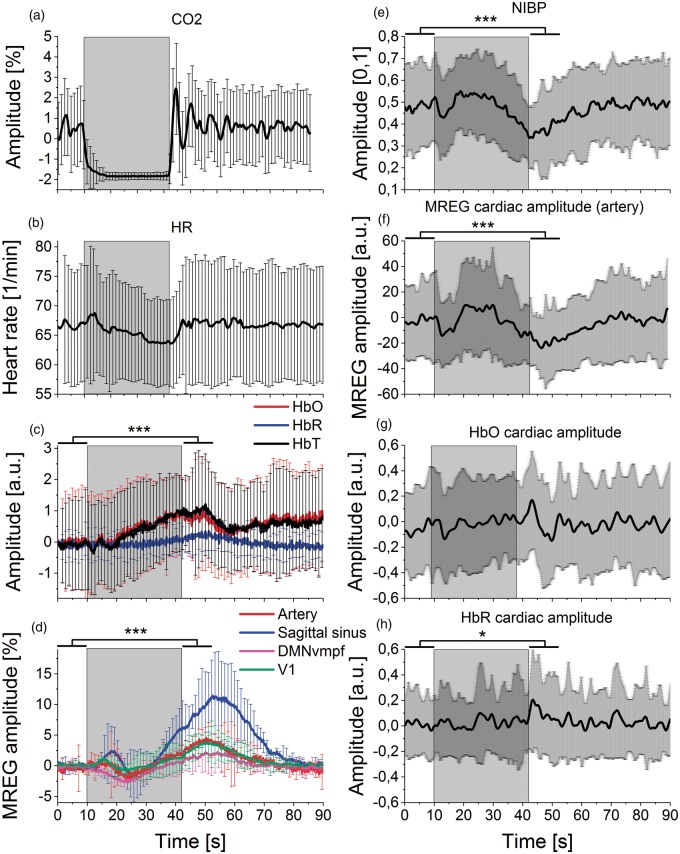
Figure 2.
Mean signal amplitude changes during BH. The grey rectangle background marks the averaged BH period (32 s). Lines represent mean of signal amplitude and error bars represent standard deviation over subjects. Significance levels p < 0.05* and p < 0.001***. (a) Breathing with carbon dioxide (CO2), (b) heart rate (HR) from non-invasive blood pressure (NIBP) pulse data. (c) Left frontobasal NIRS measurements (fullband): oxyhemoglobin (HbO, red), deoxyhemoglobin (HbR, blue), total blood volume (HbT, black). HbO steadily increases during BH. (d) Mean MREG BOLD signals in resting-state detected using FSL Melodic PICA: anterior and both median cerebral arteries (Artery, red), sagittal sinus (blue) DMNvmpf = ventromedial part of the default mode network (magenta), primary visual network (V1, green). MREG signal amplitudes showed an initial decrease and a subsequent increase that peaked during NV after BH. (e) Continuous non-invasive blood pressure (NIBP) signal. (F) Cardiovascular pulse amplitude of MREG signal from PICA-derived IC (artery) presents two drops after the onset and end of BH. Amplitude was normalized to the first BH timepoint by subtraction. (g–h) Mean NIRS cardiovascular signal pulsation amplitudes of HbO and HbR show a modulated effect of the pressure drops seen in measures above where NIBP, MREG (artery) and HbO decrease in the early stage and after BH. Amplitudes were normalized to the first BH timepoint by subtraction.

