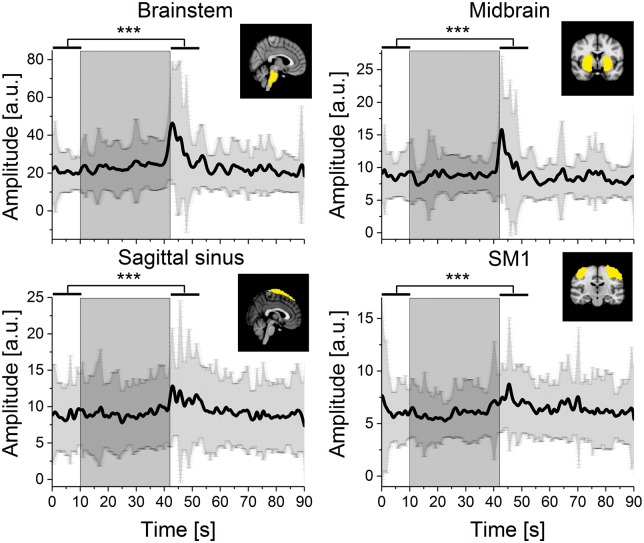
Figure 3.
Cardiovascular pulse amplitude of MREG signal during BH from ICA-based ROIs (Sagittal sinus, primary somatosensory network (SM1), midbrain and brainstem). The grey box marks the 32 s BH period. Black lines represent mean signal amplitude and the shaded dark grey error bars represent standard deviation. All selected ROIs showed significant increases in signal amplitude following BH compared to preceding NV. Significance level after Bonferroni correction p < 0.0056***.

