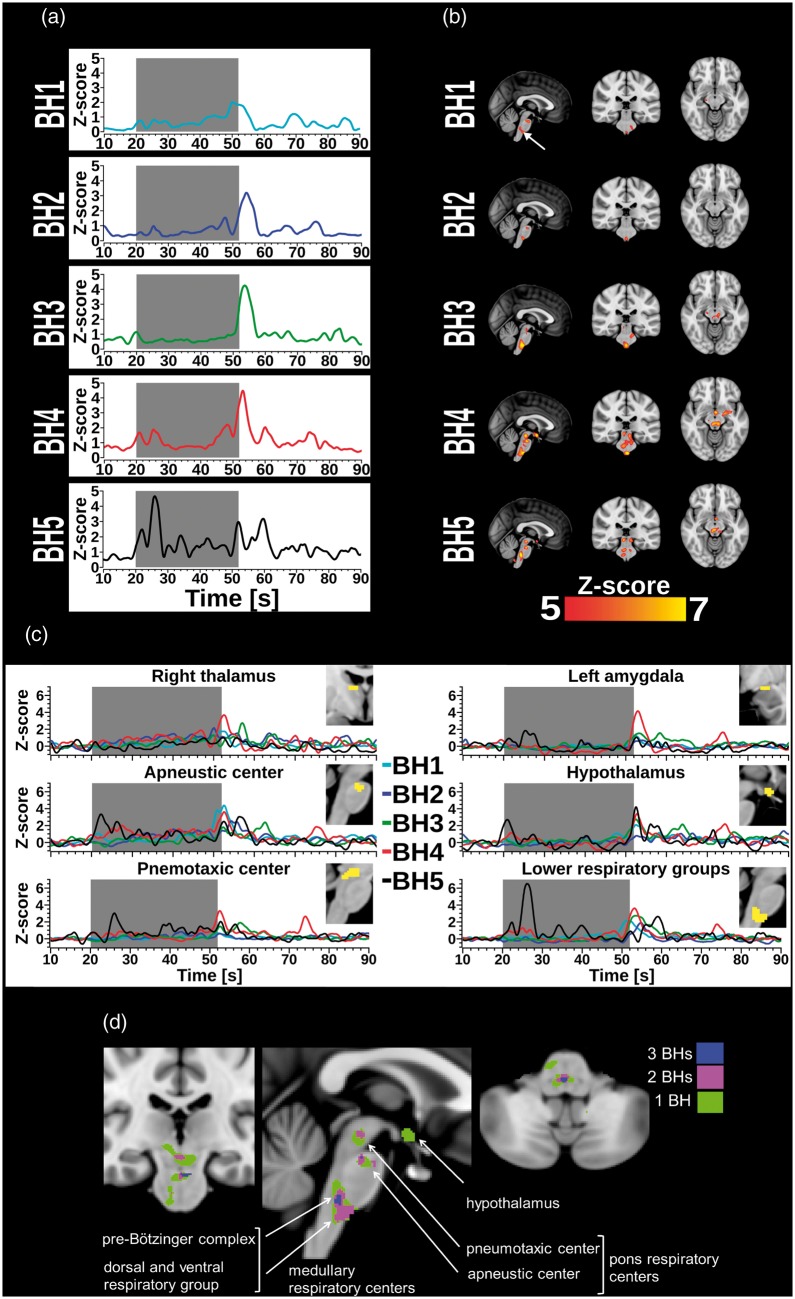
Figure 4.
(a) For each BH run, plot shows mean time course of cardiac pulse amplitude extracted from an arbitrarily selected 4 mm spherical ROI located in lower brainstem (0, −30, −51 mm in MNI). The grey box marks the 32 s BH period. Cardiac pulse amplitude increases first manifest in the lower brainstem, but start to occur in the midbrain (thalamus, hypothalamus, and amygdala) with increasing number of BH runs. (b) Panel depicts the highest cardiac pulse amplitude maps threshold at z-score > 5 (p < 0.05, FWE corrected). Cardiac pulse amplitude increases first manifest in the lower brainstem, but start to occur in the midbrain (thalamus, hypothalamus, and amygdala) with increasing number of BH runs. (c) Mean cardiovascular pulse amplitudes of respiratory network ROIs (thalamus, amygdala, hypothalamus, and brainstem regions; z > 5) varied across repeated BH runs. The grey box marks the 32 s BH period. (d) General effect of repeated BH on cardiac pulse amplitudes in the respiratory centers of the brain displayed in coronal view (y = −24 mm), sagittal view (x = 0 mm), and coronal view (y = −4, in MNI). Green, magenta, and blue voxels indicate a significant z-score>6 (threshold was raised to display contoured clusters) in 1, 2, or 3 of the 5 BH runs, respectively. Labels were added in the style of Sherwood's description of respiratory centers in “Fundamentals of Human Physiology”.44

