Figure 1.
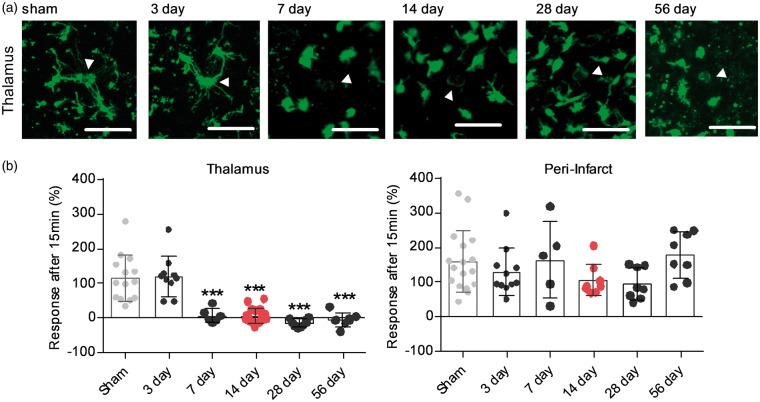
Microglia process response to laser damage over time shows a specificity to the thalamus, starts at day 7 and peaks at day 28. (a) Acute slice based two-photon imaging showing microglia response following laser injury in the ipsilateral posterior complex (Po) of the thalamus for time-points 3, 7, 14, 28, 56 days post-stroke and sham-operated animals. Images were taken 15 min after laser damage, indicated by white arrow. Scale bar, 50 µm. (b) Quantification of microglia response 15 min after laser injury for the and peri-infarct territory ipsilateral Po over time. Response is measured as change in fluorescent material (average pixel intensity) within a 10 µm Ø around the centre of the laser-injury (white arrow). Data are shown as individual data points and as mean ± STD. N thalamus = sham (14), 3 days (10), 7 days (7), 14 days (19), 28 days (10), 56 days (8); Ncortex = sham (17), 3 days (11), 7 days (5), 14 days (9), 28 days (8), 56 days (8) ***p < 0.001 relative to sham and 3 days (one-way ANOVA followed by Tukey’s multiple comparisons). Dataset microglia process response day 14 is an excerpt from Kluge et al.16

