Figure 4.
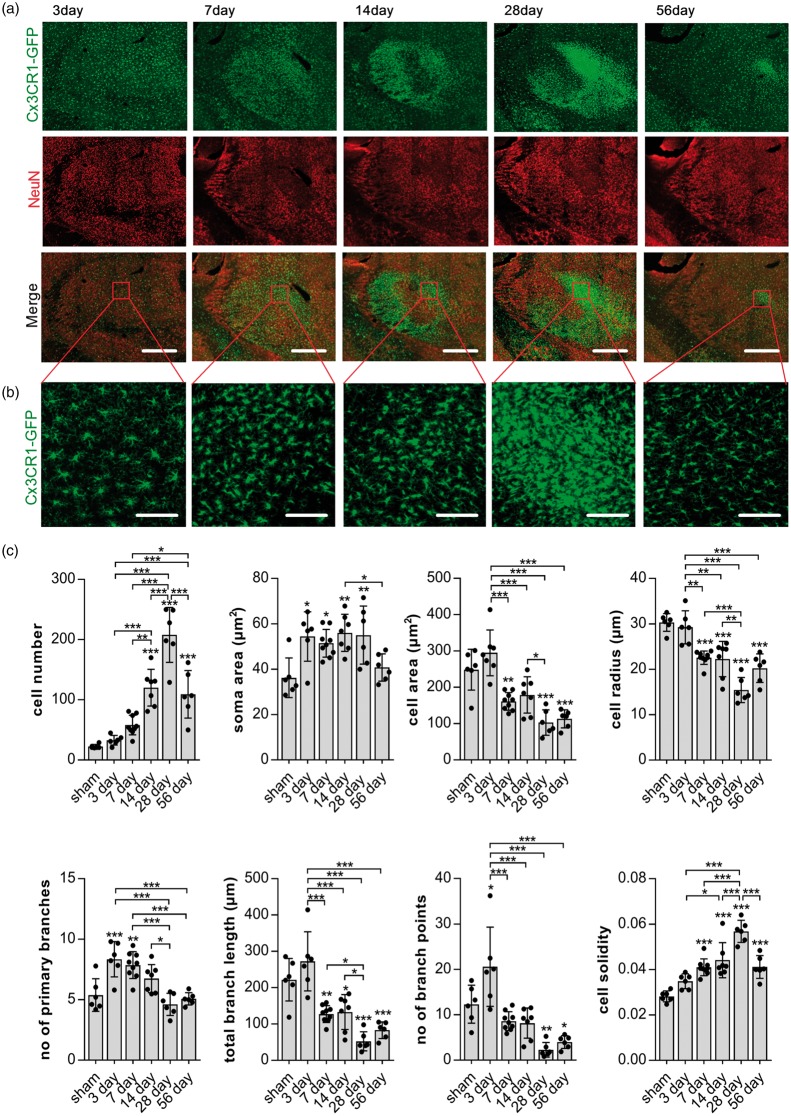
NeuN loss co-localises with morphological microglia disturbances. (a) Representative maximum projection, tile scan, confocal images of thalamic areas 3, 7 14, 28, 56 days after stroke. Fixed brain slices of Cx3CR1GFP/WT mice expressing GFP-label microglia (top panel; green) were co-labelled with NeuN antibody (middle panel; red). Merge in bottom panel. Scale bars, 500 µm. Red square indicates area of morphological reconstruction as shown in (b). (b) Representative high-magnification maximum projection confocal images of the posterior nucleus of the thalamus as indicated by the red square in (a) used for morphological analysis. Scale bars, 100 µm. (c) Quantification of microglia morphology in the Po from images shown in (b) over time. Cells were reconstructed and analysed using MicroTrac software.28 All cells within one image were individually reconstructed and morphological parameters averaged for each image, one per animal. Data are shown as individual data points and as mean ± STD. (n = 6) ***p < 0.001, **p < 0.01, *p = 0.05 (one-way ANOVA followed by Tukey’s multiple comparisons).

