Figure 6.
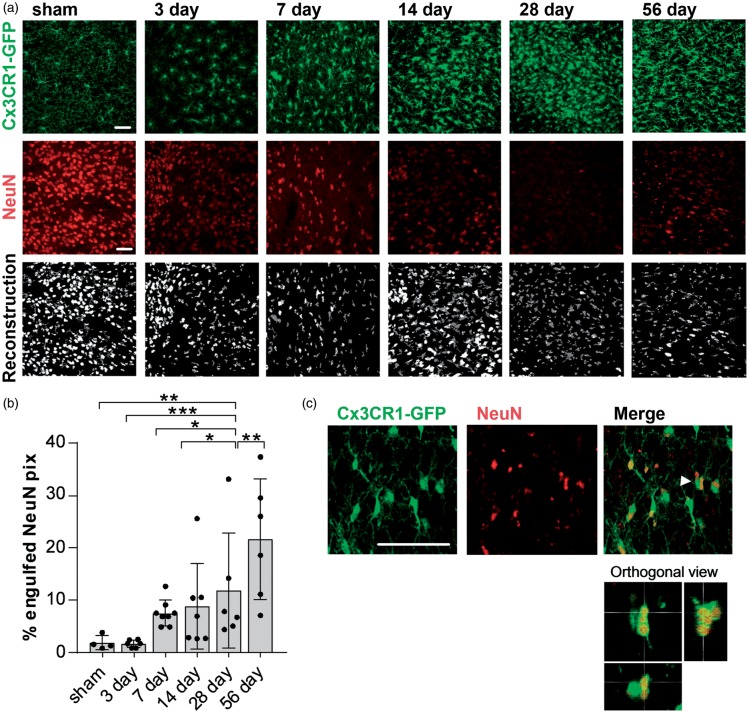
Increased NeuN phagocytosis in the posterior complex of the thalamus 56 days after stroke. (a) Representative confocal images of the posterior complex of the thalamus (Po) 3, 7 14, 28, 56 days after stroke used for the quantification of engulfed NeuN material. Top and middle panels indicate the original images for Cx3CR1-GFP and NeuN labelling, bottom panel shows the reconstruction (dark grey: GFP; white: NeuN). Scale bar, 50 µm. (b) Quantification of engulfed NeuN pixels (in %) by microglia in the Po for all time points after stroke and in sham-operated animals. Data are shown as individual data points and as mean ± STD. (n = 6) ***p < 0.001, **p < 0.01, *p < 0.05 (one-way ANOVA followed by Tukey’s multiple comparisons). (c) Representative higher magnification confocal images and orthogonal view (bottom panel) of the Po 56 days after stroke to determine full engulfment of NeuN material (red). Arrow shows cell visualized in orthogonal view. Scale bars, 50 µm.

