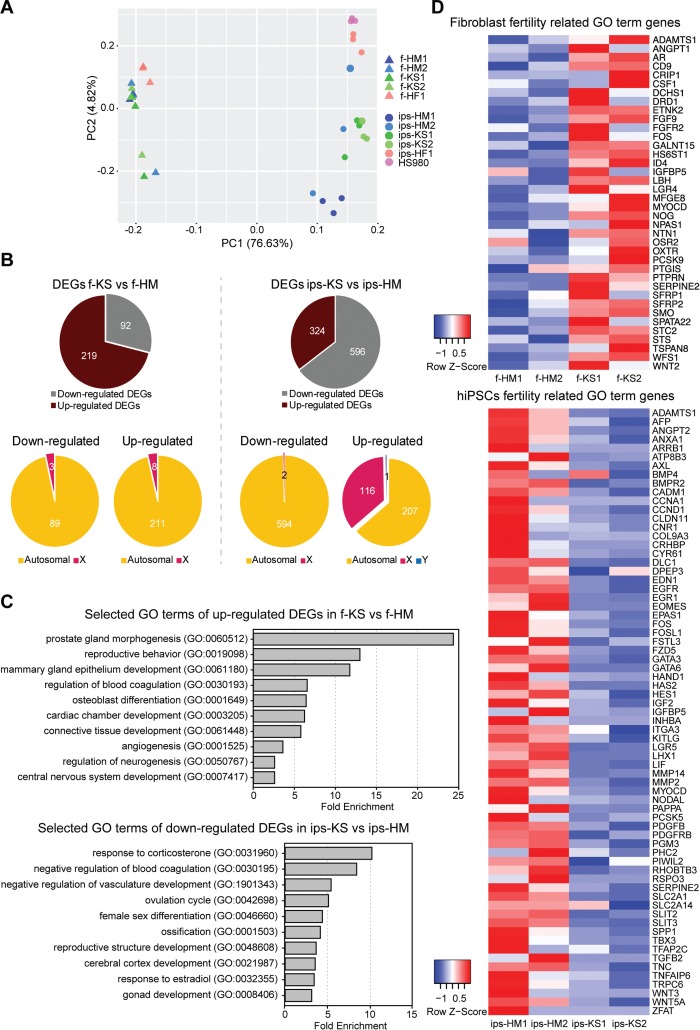
Figure 2.

KS fibroblasts and hiPSCs show differentially expressed genes (DEGs) related to the clinical genotype of the KS disorder. (A) Principal component (PC) analysis with top 10 000 expressing genes of KS, HM and HF fibroblasts (triangle) and corresponding hiPSC as well as female hESC line HS980 (circle). See also Supplementary Tables SII. (B) Downregulated and upregulated DEGs comparing KS with HM fibroblast and KS with HM hiPSCs. P < 0.05 and fold change ≥1.5. See also Supplementary Tables SII and SIII. (C) Fold change of enriched GO terms of KS disorder-related terms for upregulated DEGs of KS fibroblasts, and downregulated DEGs of KS iPSCs, FDR <0.01. See also Supplementary Tables SIV–SVI. (D) Heatmap of gene expression levels associated with fertility-related GO terms in HM and KS fibroblasts and MH and KS hiPSCs. See also Supplementary Tables SV and SVII.
