Figure 3.
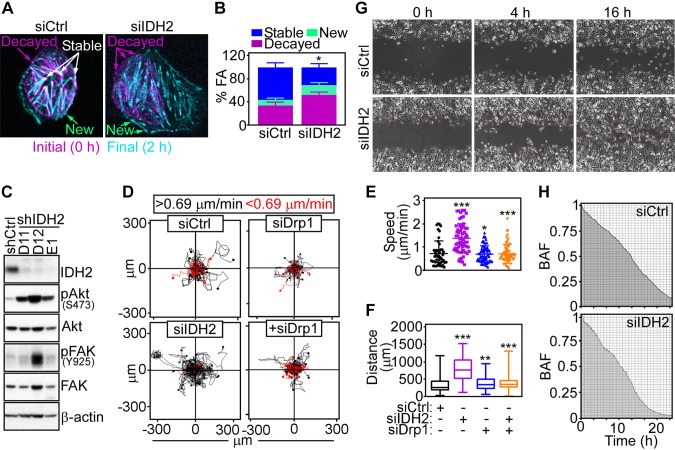
IDH2 regulation of tumor cell movements. A) PC3 cells transfected with siCtrl or siIDH2 were labeled with Talin-Red Fluorescent Protein (RFP) and analyzed for FA complex dynamics by time-lapse videomicroscopy. Representative merged frames at 0 h (magenta) and 2 h (cyan) are shown (n = 2). Arrows, position of new, stable, and decayed FA complexes. B) The conditions are as in A, and the percentage of new, stable, or decayed FA complexes was quantified per each condition (siCtrl, n = 12; siIDH2, n = 7). *P = 0.04. C) PC3 cells stably transduced with shCtrl or 3 independent IDH2-directed shRNAs (D11, D12, E1) were analyzed by Western blotting. P, phosphorylated. D) PC3 cells were transfected with siCtrl or siIDH2 and analyzed for cellular motility in 2D contour plots in the presence or absence of Drp1-directed siRNA (siDrp1). Each tracing corresponds to the movements of an individual cell. The cutoff velocities for slow-moving or fast-moving cells (<0.69 or >0.69 μm/min, respectively) are indicated. E, F) The conditions are as in D, and the speed of cell motility n = 45–66 (E)] and total distance traveled by individual cells [n = 58–66 (F)] was quantified. *P = 0.01, **P = 0.003, ***P < 0.0001. G, H) PC3 cells transfected with siCtrl or siIDH2 were analyzed for directional cell migration in a wound-closure assay (G), and the area covered by cell migration was quantified at the indicated time intervals (H). Representative images (n = 3). BAF, binary area fraction; shCtrl, control nontargeting shRNA; siCtrl, control nontargeting siRNA.

