Figure 7.
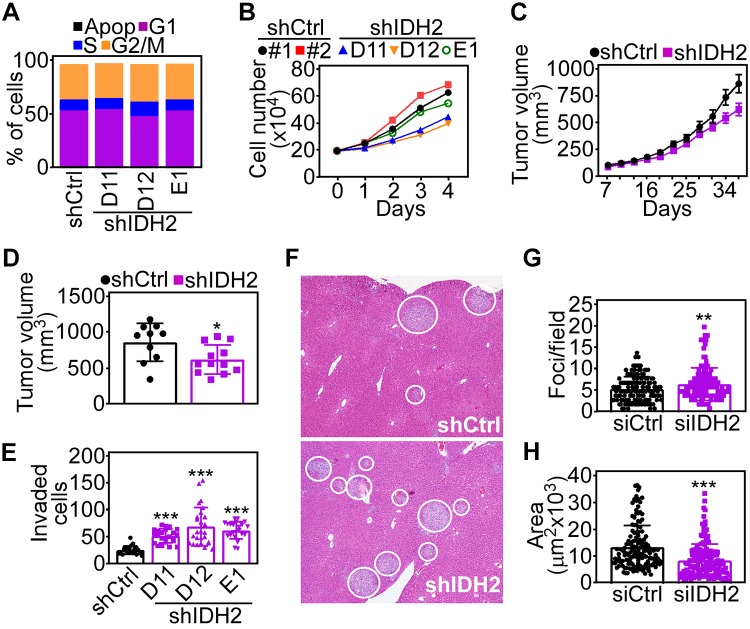
IDH2 regulation of tumor cell invasion in vivo. A) PC3 cells stably transduced with shCtrl or 3 independent IDH2-directed shRNAs (shIDH2 D11, D12, E1) were analyzed by propidium iodide staining and flow cytometry. The percentage of cells in each cell cycle phase is indicated. Apop, apoptotic. B) The conditions are as in A, and stably transduced PC3 cells were analyzed for cell proliferation by direct cell counting at the indicated time intervals. C) PC3 cells stably transduced with shCtrl or shIDH2 were engrafted subcutaneously on the flank of immunocompromised mice, and tumor growth was measured with a caliper at the indicated time intervals. Means ± sd (shCtrl, n = 10; shIDH2, n = 12). D) The conditions are as in C, and tumor volume in each animal group was determined at d 37 postengraftment. Means ± sd. *P = 0.02. E) PC3 cells stably transduced as in A were analyzed for Matrigel invasion. Means ± sd (n = 22–26). ***P < 0.0001. F) PC3 cells stably transduced as in C were injected into the spleen of immunocompromised mice, and metastatic foci to the liver were identified after 11 d by hematoxylin and eosin staining and light microscopy. Representative images; white circles, metastatic foci. G, H) The conditions are as in F, and the number [shCtrl, n = 142, shIDH2, n = 162 (G)] and surface area [shCtrl, n = 142; shIDH2, n = 162 (H)] of liver metastatic foci was quantified in each animal group. shCtrl, control nontargeting shRNA. Means ± sd. **P = 0.004, ***P < 0.0001.

