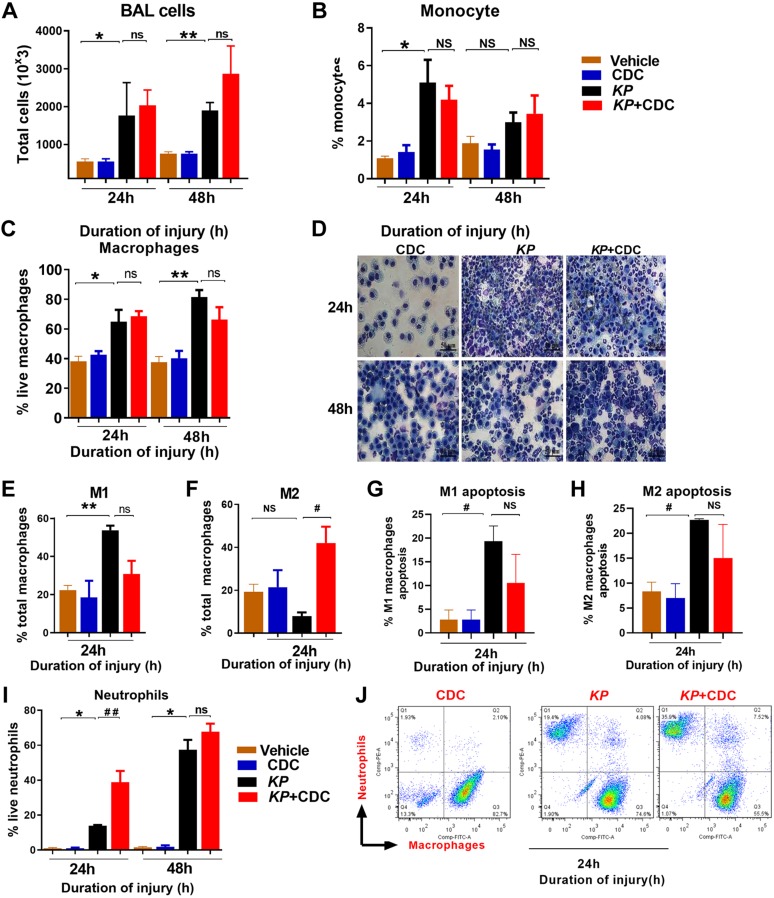
Figure 2.
A, B) CDC administration attenuates injury and inflammation following pneumonia. BAL cells: Fc data demonstrate the total number of cells (A) and the total number of monocytes (B) following KP and CDC administration. C, D) Representative Fc (C) and cytospin (D) data show the total number of macrophages following KP and CDC administration (n = 6/group). E, F) Fc data show the total number of M1s (E) and M2s (F) following KP and CDC administration (n = 6/group). G, H) M1s (G) and M2s (H) apoptosis were measured by Fc. I, J) The Fc and cytospin data reveal the level of neutrophils (I, J) the KP + CDC group compared to KP alone at both time points (n = 6/group). Samples were analyzed using a 2-tailed, unpaired Student’s t test with Welch’s correction. *P < 0.05 CDC vs. KP; #P < 0.05 KP vs. KP + CDC.

