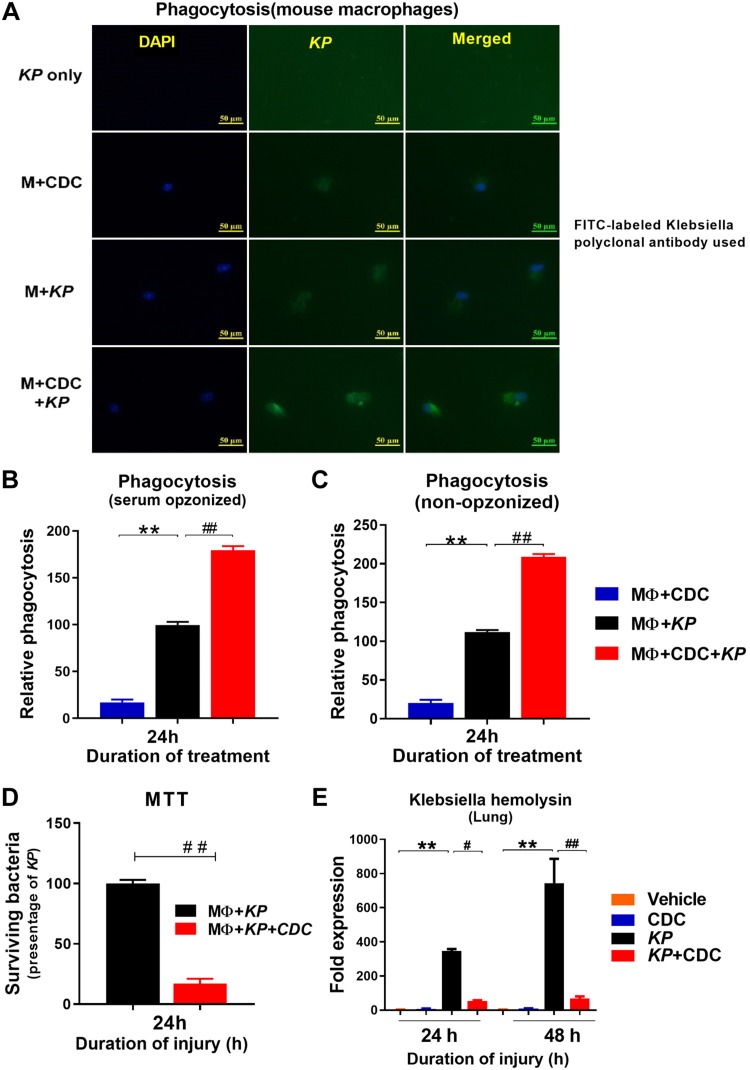
Figure 5.
AMs demonstrated increased phagocytosis of KP following CDC administration. A) Phagocytosis: AM phagocytosis was measured using fluorescence exposure and anti-KP antibody. B, C) In vitro serum opsonized (B) and nonopsonized (C) phagocytosis was also measured (n = 5/group). D) MTT assay: Bactericidal activity was performed (n = 5/group). E) Khe expression: Lung RNA was isolated from the mice in the presence and absence of CDC following pneumonia, and Khe expression was measured at 24 and 48 h (n = 5/group). Statistical analysis was performed at each time point. Samples were analyzed using a 2-tailed, unpaired Student’s t test with Welch’s correction. *P < 0.05 CDC vs. KP; #P < 0.05 KP vs. KP + CDC.

