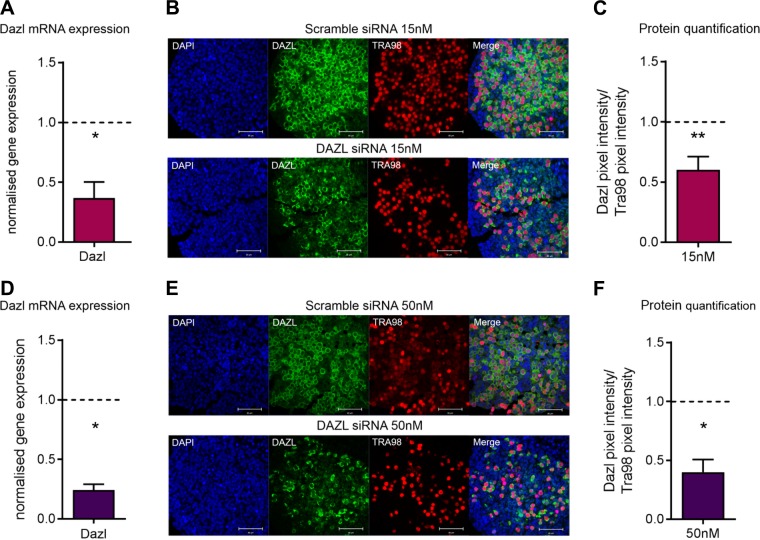
Figure 1.
Validation of Dazl knockdown in e13.5 cultured ovaries using 15 and 50 nM of siRNA. A) Dazl mRNA expression in Dazl hypomorph ovaries relative to scramble-control ovaries cultured with 15 nM of siRNA. Expression was analyzed 3 d after transfection. Graph displays means of n = 4 ovaries for each group. Expression in scramble-control ovaries depicted by dashed line. Error bars indicate means ± se. P = 0.028, Mann-Whitney. B) Representative image of immunostaining for Dazl (green) and Tra98 (red) in Dazl hypomorph and scramble-control ovaries cultured with 15 nM of siRNA. Immunostaining was performed 3 d after transfection. Scale bars, 50 µM. C) Quantification of Dazl and Tra98 immunostaining in Dazl hypomorph and scramble-control ovaries cultured with 15 nM of siRNA. Graph displays mean of Dazl immunostaining pixel-intensity relative to Tra98 immunostaining pixel-intensity relative. Error bars indicate means ± se; n = 4 ovaries for each group. P = 0.002, Mann-Whitney. D) Dazl mRNA expression in Dazl hypomorph ovaries relative to scramble-control ovaries cultured with 50 nM of siRNA. Expression was analyzed 3 d after transfection. Graph displays means of n = 4 ovaries for each group. Expression in scramble-control ovaries depicted by dashed line. Error bars indicate means ± se. P = 0.028, Mann-Whitney. E) Representative image of immunostaining for Dazl (green) and Tra98 (red) in Dazl hypomorph and scramble-control ovaries cultured with 50 nM of siRNA. Immunostaining was performed 3 d after transfection. Scale bars, 50 µM. F) Quantification of Dazl and Tra98 immunostaining in Dazl hypomorph and scramble-control ovaries cultured with 50 nM of siRNA. Graph displays mean of Dazl immunostaining pixel-intensity relative to Tra98 immunostaining pixel-intensity relative. Error bars indicate means ± se; n = 4 ovaries/group. P = 0.05, Mann-Whitney.

