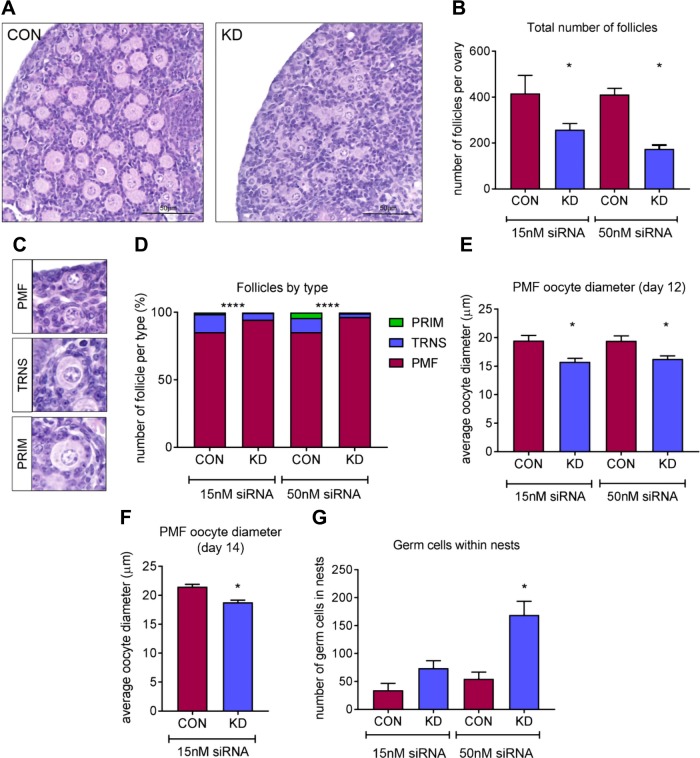
Figure 3.
Assessment of follicles after 12 d of culture in e13.5 cultured ovaries using 15 and 50 nM of siRNA. A) Representative hematoxylin and eosin images from Dazl hypomorph and scramble-control siRNA ovaries cultured for 12 d. Scale bar, 50 µM. B) Graph depicts total number of follicles in Dazl hypomorph and scramble-control ovaries cultured for 12 d with 15 and 50 nM of siRNA for the first 3 d of culture. Error bars indicate means ± se; n = 7–8 ovaries/group. P = 0.0234 (15 nM dose); P = 0.016 (50 nM dose), Wilcoxon test. C) Representative hematoxylin and eosin images of PMFs, TRNs, and PRIMs; PMFs were defined as having only squamous pregranulosa cells, TRNs were considered to have both squamous and cuboidal granulosa cells, and PRIMs had a complete layer of cuboidal granulosa cells. D) Graph depicts the proportion of follicles staged as PMF, TRN, or PRIM in Dazl hypomorph and scramble-control ovaries cultured for 12 d with 15 and 50 nM of siRNA for the first 3 d of culture; n = 7–8 ovaries/group, P < 0.0001, χ2 test. E) Graph depicts PMF diameter in oocytes from Dazl hypomorph and scramble-control cultured ovaries. Ovaries were cultured for 12 d with siRNA for the first 3 d. All PMFs were measured in each ovary. Error bars indicate means ± se; n = 5. P = 0.01 (15 nM); P = 0.0238 (50 nM), Wilcoxon test. F) Graph depicts PMF diameter in oocytes from Dazl hypomorph and scramble control –cultured ovaries. Ovaries were cultured for 14 d with 15 nM dose of siRNA for the first 3 d. A total of 75 PMFs were measured from 2 Dazl hypomorph and scramble-control ovaries. Error bars indicate means ± se; n = 2. P < 0.0001, Wilcoxon test. G) Graph depicts number of germ cells found in nest structures in Dazl or scramble-control siRNA ovaries after 12 d of culture. All germ cells found in nests in each ovary were counted. Con, control; KD, knockdown. Error bars indicate means ± se; n = 7–8 ovaries/group. P = 0.016, Wilcoxon test.

