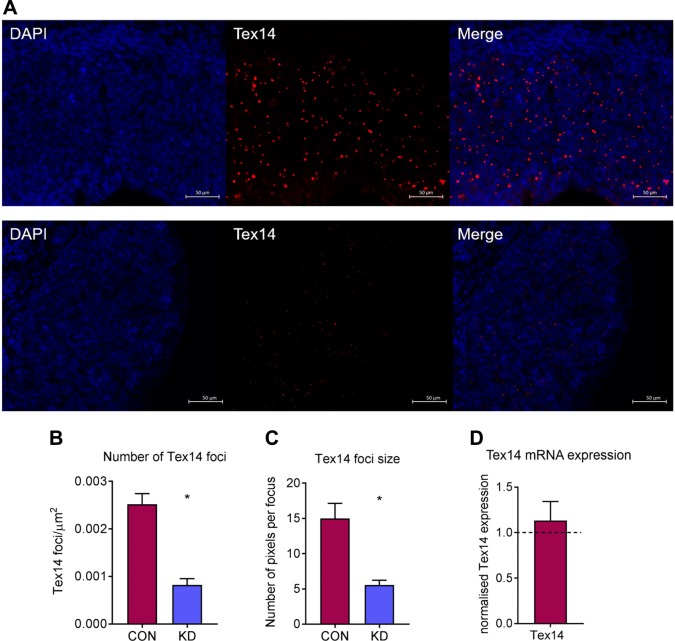
Figure 5.
Assessment of intercellular bridge formation at d 2 of culture in e13.5 cultured ovaries using 50 nM of siRNA. A) Representative images of Tex14 immunostaining in scramble-control and Dazl hypomorph ovaries cultured with 50 nM of siRNA. Scale bars, 50 µM. B) Quantification of Tex14 foci in scramble-control and Dazl hypomorph ovaries. Graph displays total number of foci relative to the area of the ovary. Error bars indicate means ± se; n = 4 ovaries/group. P = 0.029, Mann-Whitney. C) Quantification of Tex14 focus size in scramble-control and Dazl hypomorph ovaries. Graph displays the number of pixels per Tex14 focus. Error bars indicate means ± se; n = 4 ovaries/group. P = 0.029, Mann-Whitney. D) Tex14 mRNA expression in Dazl hypomorph ovaries relative to scramble-control ovaries. Expression was analyzed 3 d after transfection. Con, control; KD, knockdown. Graph displays means of n = 4 ovaries for each group. Expression in scramble-control ovaries depicted by dashed line. Error bars indicate means ± se.

