Figure 4.
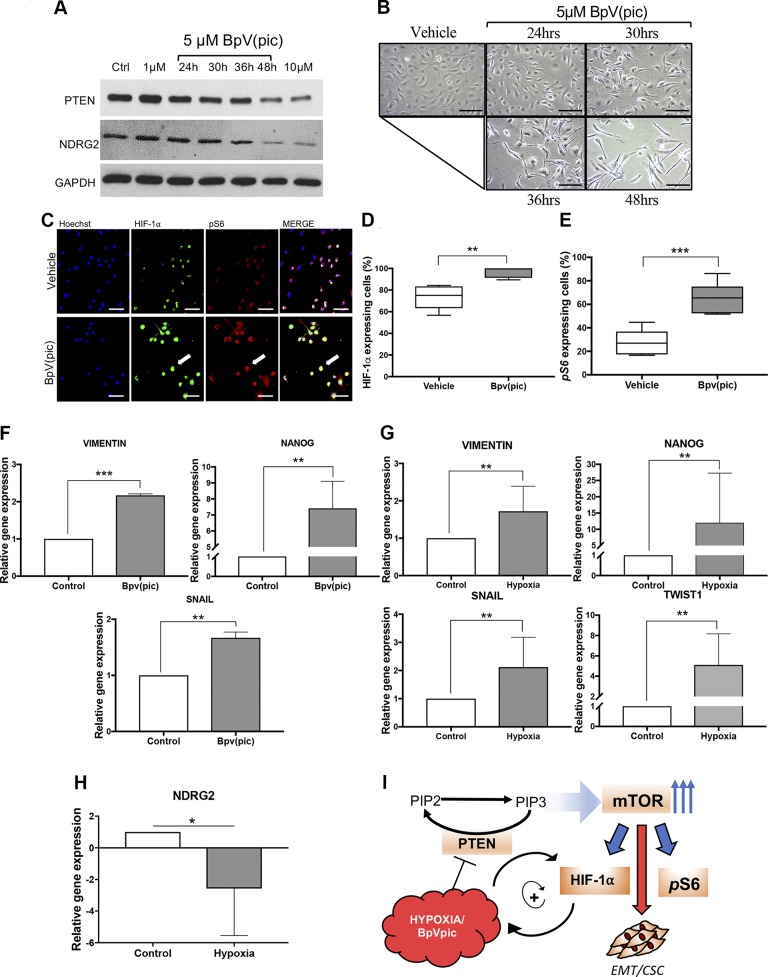
Pharmacological down-regulation of PTEN activates HIF-1α expression and triggers an EMT phenotype on HNSCC. A) Administration of BpV(pic) efficiently down-regulated PTEN and NDRG2 after 48hrs of treatment. B) HNSCC tumor cells exposed to BpV(pic) acquire a fusiform phenotype. C) Administration of BpV(pic) triggers the accumulation of HIF-1α and pS6 as demonstrated by immunofluorescence staining. Note colocalization of HIF-1α and pS6 in tumor cells (arrow). D, E) Quantification of HIF-1α (D) and pS6 (E) immunostainings upon administration of BpV(pic). **P < 0.01, ***P < 0.001. F) Real-time PCR of HNSCC cells receiving the PTEN inhibitor BpV(pic) demonstrate up-regulation of VIM, Snail, and Nanog genes. ***P < 0.001, ****P < 0.0001. G) Tumor cells growing under hypoxic conditions also present higher gene expression levels of VIM, Snail, and Nanog, along with Twist-1. *P < 0.05, ***P < 0.001, ****P < 0.0001. H) Real-time PCR demonstrate down-regulation of NDRG2 in head and neck cell line during hypoxic conditions. ***P < 0.001. I) Schematic representation of similar effects of hypoxia and BpV(pic) on the down-regulation of PTEN, followed by the up-regulation of HIF-1α and pS6. Scale bars, 100 μm.

