Figure 5.
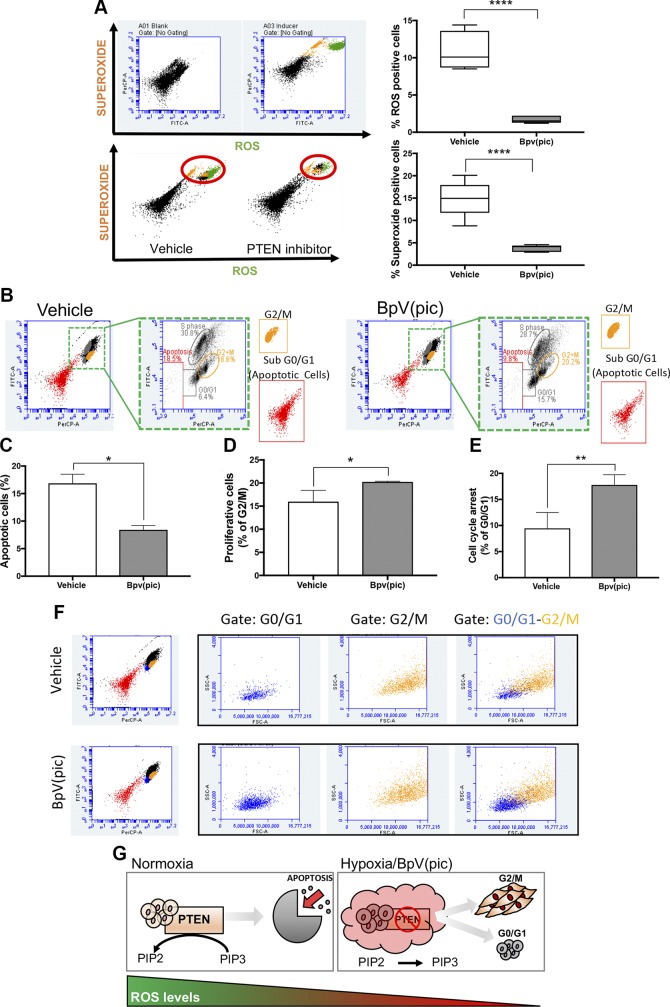
PTEN inhibition reduces ROS and enhances tumor proliferation. A) Flow cytometry for ROS and superoxide of HNSCC cells receiving 5 μM BpV(pic) or vehicle for 48 h. Note reduced levels of ROS and superoxide upon administration of BpV(pic). Data represent means ± sem. ****P < 0.0001. B–D) Detection of DNA synthesis using BrdU combined with flow cytometry demonstrate reduced apoptosis and increased proliferation of tumor cells receiving BpV(pic). Data represent means ± sem. *P < 0.05. E) Detection of DNA synthesis using BrdU combined with flow cytometry also identified a population of tumor cells undergoing G0/G1 upon administration of BpV(pic). F) Flow cytometry analysis identifies 2 distinct populations of tumor cells under G0/G1 and G2/M. G) Schematic representation of PTEN inhibition associated with reduced ROS levels and reduced apoptosis, resulting in augmented tumor proliferation of HNSCC cells.

