Figure 6.
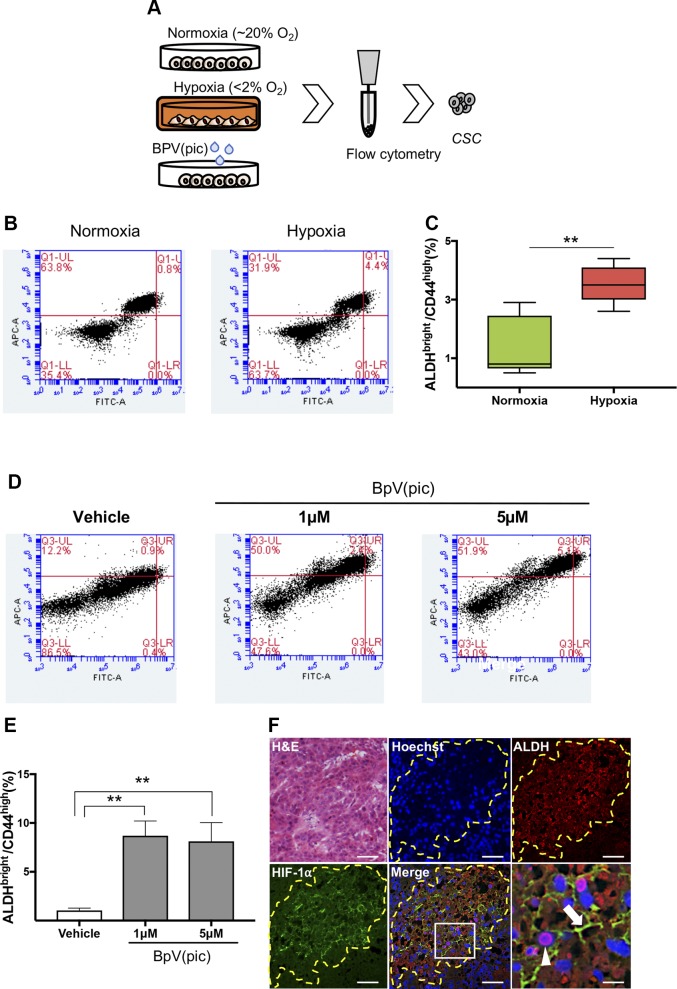
Accumulation of CSCs upon PTEN loss of function. A) Schematic representation of flow cytometry assay using HNSCC cell lines cultured under normoxia and hypoxic conditions and receiving BpV(pic). B, C) Tumor cells cultured under normoxia and hypoxia (12 h), showing increased levels of ALDHBright and CD44high positive cells. Data represent means ± sem. *P < 0.05. D) Representative graphic depicting augmented ALDHBright- and CD44high-positive tumor cells receiving BpV(pic) treatment and vehicle control for 24 h. E) Note a concentration-dependent accumulation of ALDHBright and CD44high positive cells upon receiving BpV(pic) for 24 h. **P < 0.01. F) Tumor-derived from HNSCC xenografts demonstrates hypoxic niches within tumor mass expressing high levels of ALDH1A1 and HIF-1α. Arrows indicate cytoplasmic expression of HIF-1α and the arrowhead indicates ALDH1A1 positive tumor cells. Scale bars, 100 μm.

