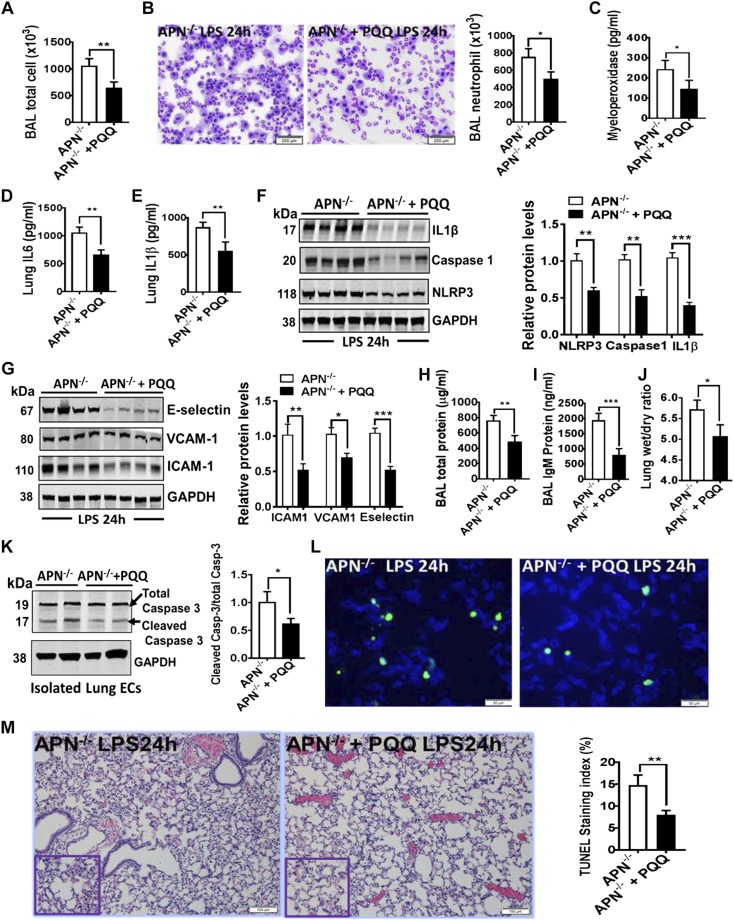
Figure 6.
PQQ-mediated improved mitochondrial biogenesis and function alleviates LPS-induced ALI in APN−/− mice. A, B) Total and neutrophil cell counts in the BAL fluid from APN−/− ALI mice with and without treatment of PQQ; n = 8 in each group. C) Myeloperoxidase levels in lungs; n = 8 in each group. D, E) ELISA for IL-6 and IL-1β in lungs of APN−/− ALI mice with and without treatment of PQQ; n = 8 in each group. F) Western blot analysis for NLRP3, activated caspase-1, and cleaved IL-1β in the whole lung tissues of APN−/− ALI mice with and without treatment of PQQ; n = 6 in each group. G) Western blot analysis for ICAM-1, VCAM-1, and E-selectin in the whole lung tissues of APN−/− ALI mice with and without treatment of PQQ. Densitometry analysis is shown on the right; n = 8 in each group. H, I) Total and IgM protein concentration in BAL fluid; n = 8 in each group. J) Lung wet-dry ratio in APN−/− ALI mice with and without treatment of PQQ; n = 8 in each group. K) Western blot analysis for cleaved caspase-3 (Casp-3) in lungs of APN−/− ALI mice with and without treatment of PQQ; n = 6 in each group. L) Representative terminal deoxynucleotidyl transferase dUTP nick end labeling staining (green color) of apoptotic cells in lungs of APN−/− ALI mice with and without treatment of PQQ; n = 4 in each group. M) Representative image of H&E-stained lungs of APN−/− ALI mice with and without treatment of PQQ; n = 5 in each group. Densitometry analyses are shown on the right. Data are expressed as means ± se. Scale bars, 200 µm (B); 100 µm (L). *P < 0.05, **P < 0.01, ***P < 0.001.

