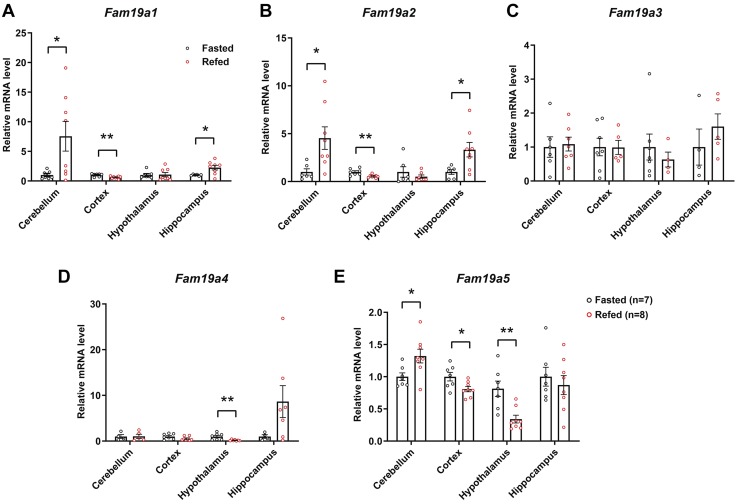
Figure 2.
Altered expression of Fam19a1-a5 in different mouse brain regions in response to unfed and refed states. Real-time PCR analysis of Fam19a1 (A), Fam19a2 (B), Fam19a3 (C), Fam19a4 (D), and Fam19a5 (E) expression in the cerebellum, cortex, hypothalamus, and hippocampus of mice subjected to being unfed overnight (unfed group; n = 7) or unfed overnight followed by 3 h of refeeding (refed group; n = 8). Expression levels were normalized to β-actin. Data are expressed as means ± sem. Two-tailed Student’s t tests were used for comparing gene expression of unfed vs. refed states in different brain regions. *P < 0.05, **P < 0.01.

