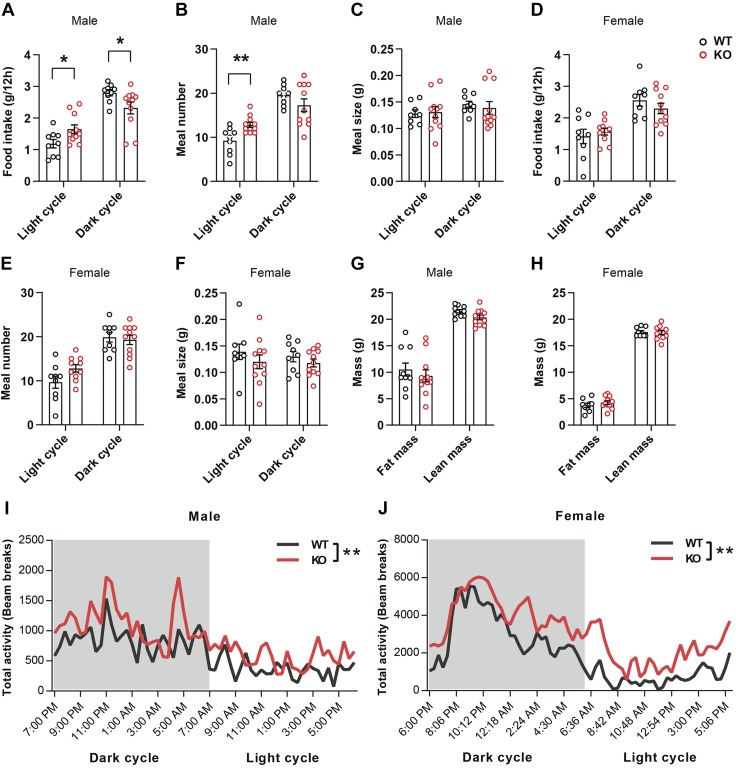
Figure 4.
Altered food intake patterns and increased physical activity in Fam19a1 KO mice. A–F) Food intake, meal number, and meal size during light and dark cycles in WT and KO male mice (A–C) and female mice (D–F). G, H) Echo-MRI measurements of fat and lean mass in WT and KO mice; 2-tailed Student’s t tests were used for comparing data of WT vs. KO mice. I, J) Physical activity (in the metabolic cage) during light and dark cycle in WT and Fam19a1 KO mice. Two-way ANOVA tests were used for comparing overall activity of WT vs. KO mice. Male mice: WT, n = 9; KO, n = 11. Female mice: WT, n = 9; KO, n = 11. Data are expressed as means ± sem. *P < 0.05, **P < 0.01.

