Figure 5.
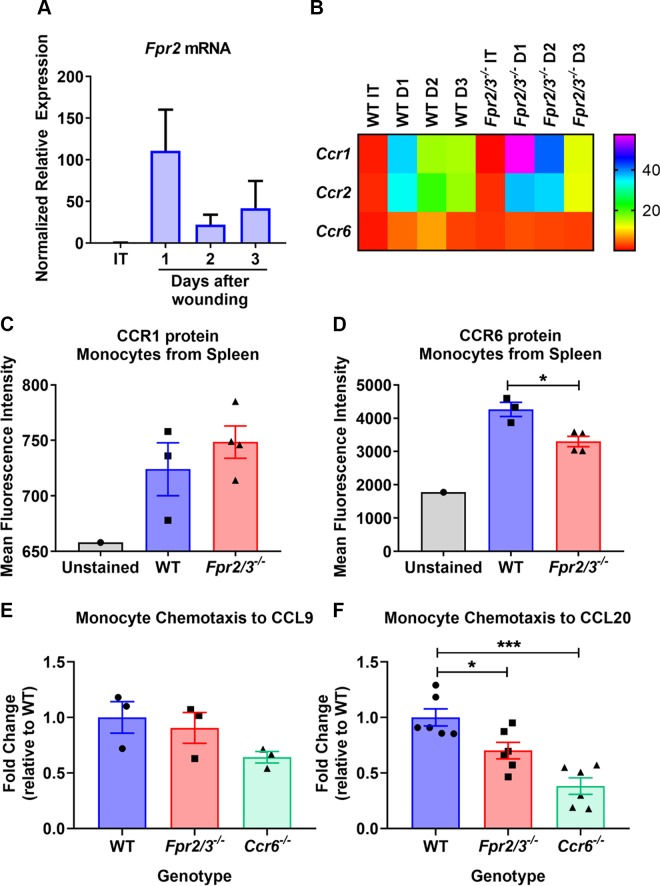
Monocytes lacking FPR2 expression have a deficit in their chemotactic response. A) Fpr2 mRNA levels were determined by qPCR of RNA isolated from monocytes collected from the lamina propria of WT intact tissue or resealing colonic wounds isolated from mice (n = 3–4). B) Heat map representation of expression levels of Ccr1, Ccr2, and Ccr6 mRNA in monocytes was determined by qPCR analysis of RNA (n = 3–4). C, D) Flow cytometric analysis of CCR1 (C) and CCR6 (D) expression on monocytes isolated from spleens of WT or Fpr2/3−/− mice. E, F) In vitro migration of spleen monocytes isolated from WT or Fpr2/3−/− mice toward CCL9 (n = 3) (E) or CCL20 (n = 6) (F). The rate of migration is represented as the fold change relative to WT based on the ratio of total monocytes added to the upper chamber of the Transwell to the number of cells migrated into the bottom. MFI, mean fluorescence intensity. Statistical comparisons performed using 1-way ANOVA with Bonferroni’s multiple comparison or paired Student’s t test. *P < 0.5, ***P < 0.001 (means ± sem).

