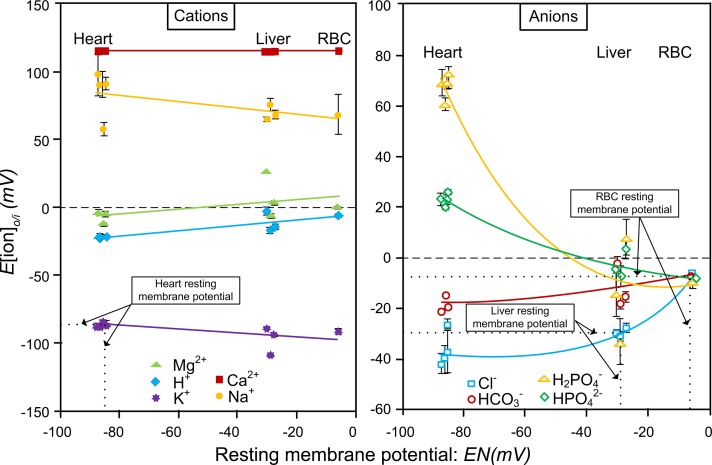
Figure 1.
The calculated Nernst potentials of the individual inorganic ions in tissues is plotted vs. the resting membrane potentials, EN. The x axis is the resting membrane potential of each of the 3 tissue types. The intersection of the measured resting membrane potential on the x axis for the 3 tissues, heart, liver, and red blood cell with the resting potential calculated on the y axis is shown by dotted lines for each of the 3 tissues. This intersection identifies the ions reflecting the resting membrane potential. For the heart, K+ reflects the resting potential at −83 mV; for the liver, Cl− reflects the resting membrane potential at −28 mV, and for the red blood cell Cl− and HCO3−, both reflect the resting membrane potential at −7 mV (11).

