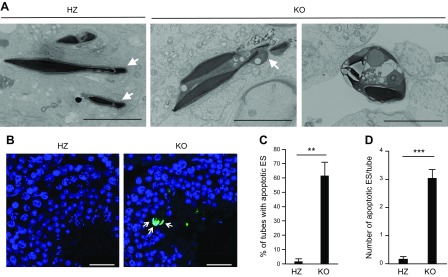
Figure 5.
Apoptosis of ESs in ACSL6 KO mice. A) FE-SEM images of ACSL6 HZ and KO testes. The arrows show the acrosomes. Scale bars, 4 µm. B) TUNEL staining of ACSL6 HZ and KO seminiferous tubules. Nuclei are stained blue (Hoechst). Apoptotic cells are green (TUNEL). The arrows indicate ES undergoing apoptosis. Scale bars, 30 µm. C, D) The percentage of tubes with apoptotic ES (C) and the number of apoptotic ES per tubules (D). Data are presented as means ± sem (n = 3). **P < 0.01, ***P < 0.001 (unpaired Student’s t test).

