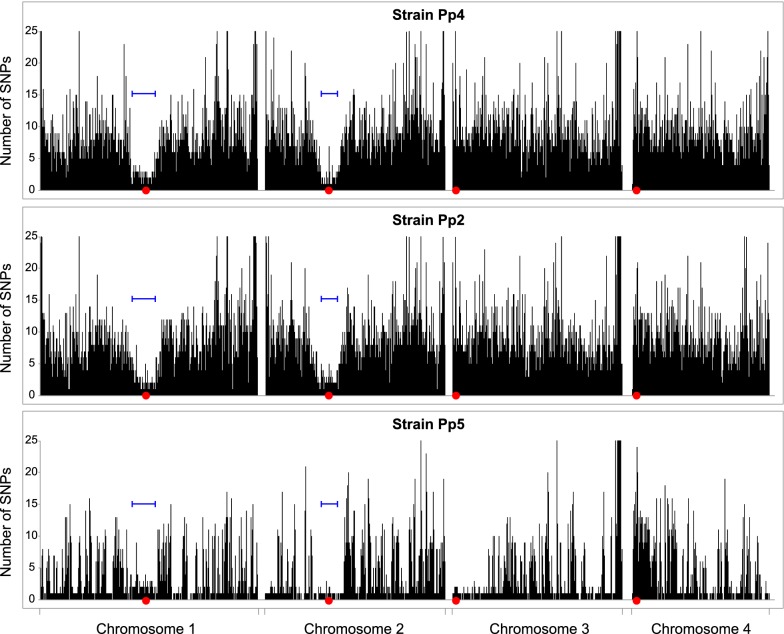
Fig. 6.
SNP density variation in natural isolates. For strains Pp4, Pp2, and Pp5, the number of SNP differences from CBS7435 in each 1-kb interval along each chromosome is plotted. Red dots mark centromeres, and blue bars mark the locations of the low-diversity regions that were defined in Pp4. The Y-axis maximum has been truncated to 25 SNPs/kb

