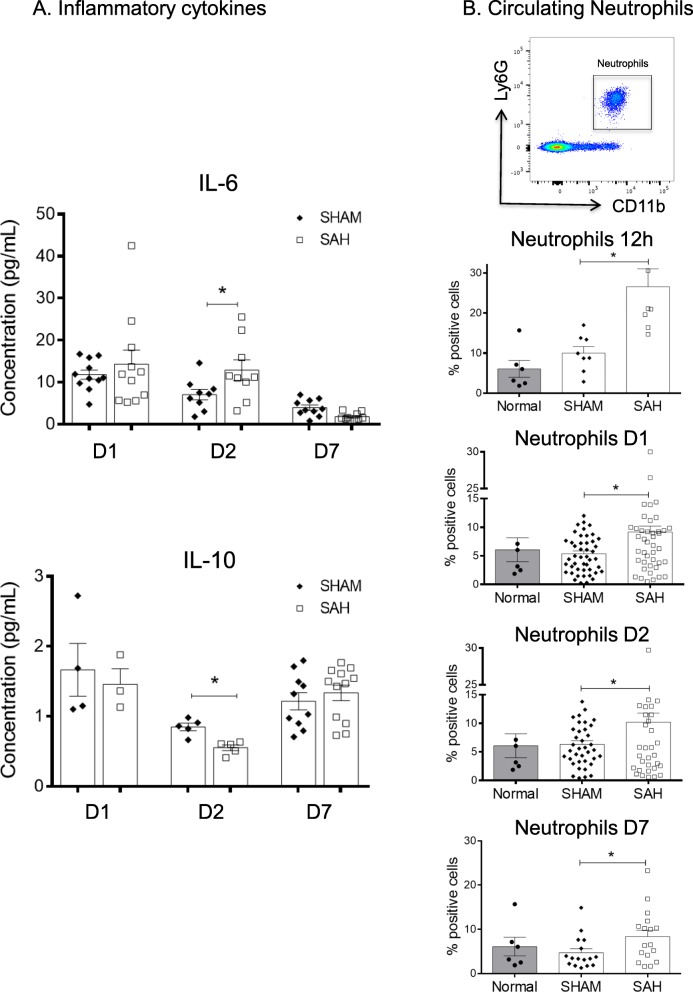
Fig. 2.
SAH is linked to a systemic modulation of inflammatory cytokines and neutrophils. a Quantification of IL-6 and IL-10 levels in the plasma at D1 (nSHAM = 4, nSAH = 3), D2 (nSHAM = nSAH = 5) and D7 (nSHAM = 10, nSAH = 12). At D2, we found a significant increase in IL-6 (*p = 0.049) and significant decrease in IL-10 (*p = 0.002) levels in the SAH mice (white squares) compared with SHAM mice (black diamonds). b Representative dot plots and quantification of neutrophil percentages (CD11b+Ly6G+) in the blood. Over time, we observed a sustained increase in neutrophil percentages at 12 h (*p = 0.0035, nSHAM = nSAH = 8), D1 (*p = 0.002, nSHAM = 51, nSAH = 52), D2 (*p = 0.027, nSHAM = 35, nSAH = 34) and D7 (*p = 0.042, nSHAM = nSAH = 19) following SAH (white squares) compared with SHAM (black diamonds). The neutrophil percentages from normal mice (n = 6, black circles) are not different from the SHAM mice

