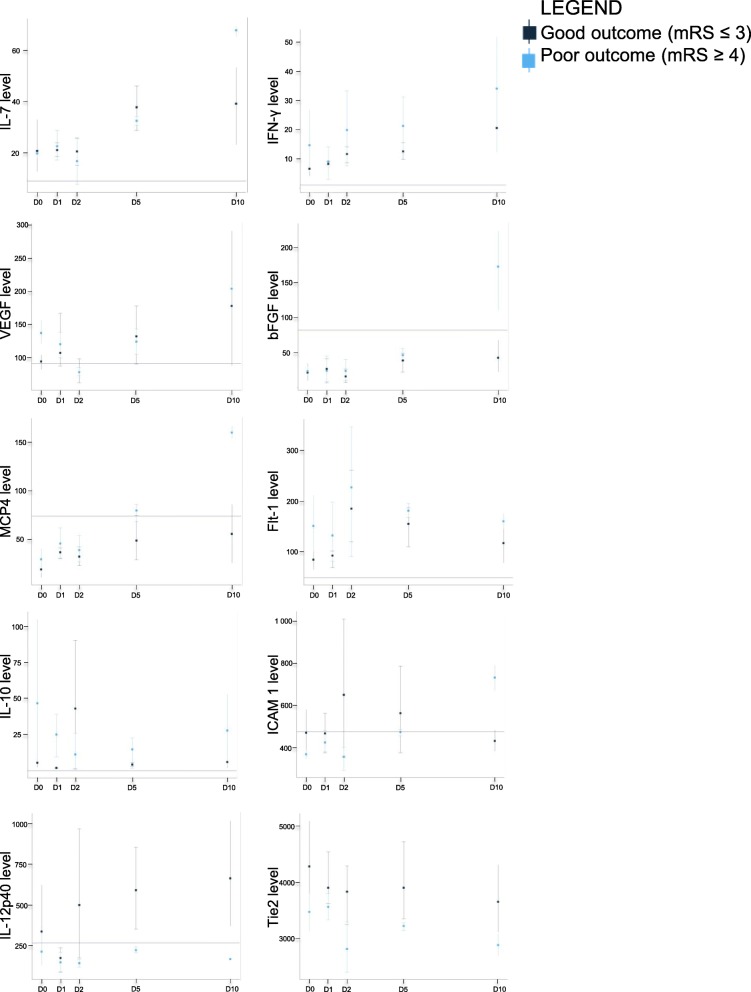
Fig. 7.
Cytokine variation and outcomes by human immunomonitoring. Group-wise mean levels and distribution of selected cytokines at D0, D1, D2, D5, and D10 stratified by outcomes, 7 patient had good outcomes (good outcome defined as an mRS of 0–3 at 1 year), 3 patients had worse outcomes and 3 patients had unknown outcomes, with baseline levels in healthy controls (line parallel to the x axis). Our observations support a different longitudinal evolution among patients with favorable outcomes compared with those with a worse outcome based on ICAM-1, bFGF, IL-7, IL-12p40, and MCP-4

