Fig. 1.
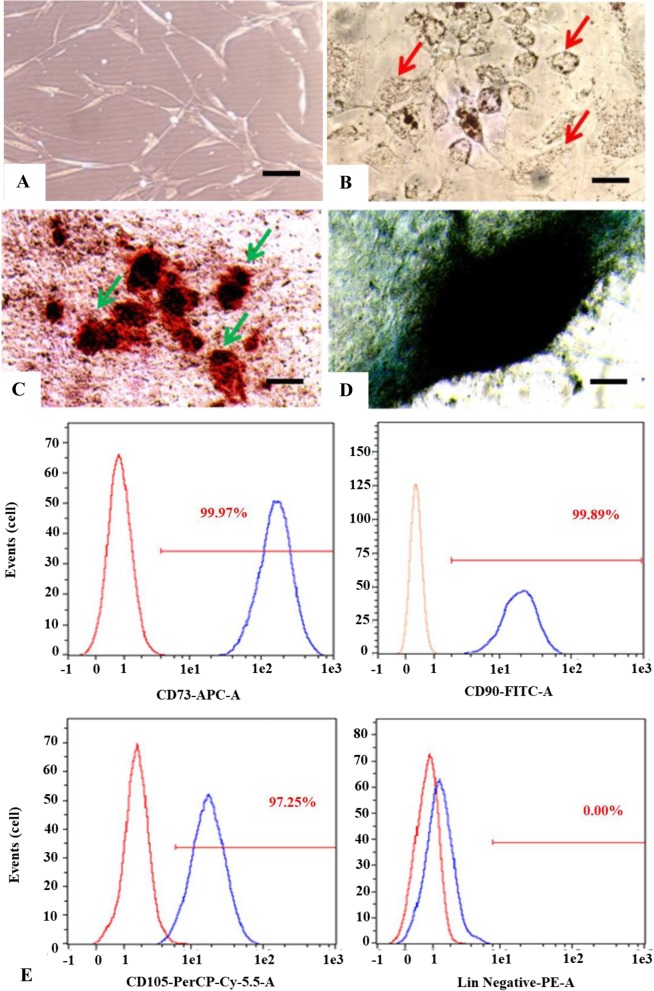
Isolated cells from adipose tissue at passage 1 day 3 showed fibroblast-like morphology (a); multipotency of cells at passage 2 isolated from adipose tissue: differentiation into adipocytes characterized by lipid droplets (red arrows) using Oil Red O staining (b); osteocytes characterized by calcium deposits (green arrow) using alizarin red staining (c); chondrocytes formed micromass-like structures (d) using alcian blue staining (black bar = 100 μm) Optilab Microscope, Nikon; Cells at passage 3 expresses CD73 (99.97%), CD90 (99.89%), CD105 (97.25%) and CD45/CD34/CD11b/CD19/HLA-DR less than 2%. Blue peak histogram indicates Fig 2. Proliferation of ADSCs cultured on silk fibroin scaffold with 500 μm pore size (ADSC-SS); Y axis is the proliferation rate of ADSC-SS, X axis indicates the observation day. The proliferation rate of ADSC-SS on various media is gradually increased. On day 21, the proliferation rate of ADSC-SS PRP group is significantly higher than negative and positive controls, respectively (*p < 0.05 indicates statistical significance). Sample and red peak histogram indicates isotype control (e)

