Fig. 2.
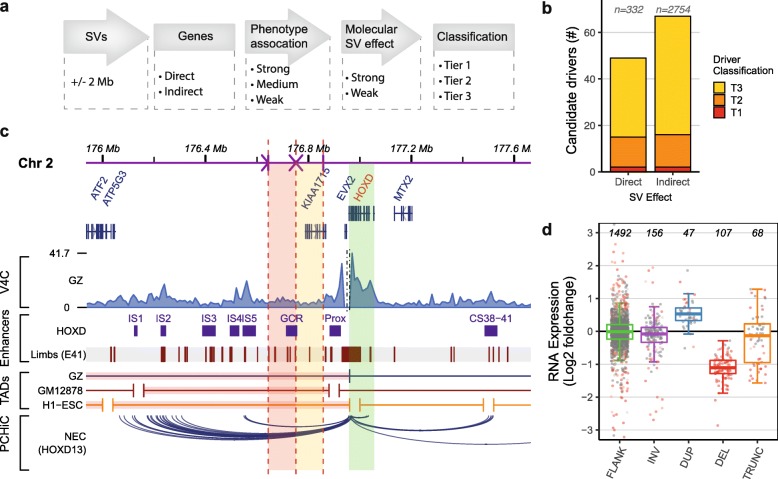
Prediction of candidate driver genes directly and indirectly affected by the SVs. a Schematic overview of the computational workflow developed to detect candidate driver genes. Classification of genes at (direct) or surrounding (indirect) the de novo SVs is based on the association of the gene with the phenotype and the predicted direct or indirect effect on the gene (Table 1). b Total number of identified tier 1, 2, and 3 candidate driver genes predicted to be directly or indirectly affected by an SV. c Genome browser overview showing the predicted disruption of regulatory landscape of the HOXD locus in individual P22. A 107-kb fragment (red shading) upstream of the HOXD locus (green shading) is translocated to a different chromosome, and a 106-kb fragment (yellow shading) is inverted. The SVs affect the TAD centromeric of the HOXD locus which is involved in the regulation of gene expression in developing digits. The translocated and inverted fragments contain multiple mouse [43] and human (day E41) [44] embryonic limb enhancers, including the global control region (GCR). Disruptions of these developmental enhancers likely contributed to the limb phenotype of the patient. The virtual V4C track shows the Hi-C interactions per 10 kb bin in germinal zone (GZ) cells using the HOXD13 gene as viewpoint [35]. The bottom track displays the PCHiC interactions of the HOXD13 gene in neuroectodermal cells [40]. UCSC Liftover was used to convert mm10 coordinates to hg19. d RNA expression levels of genes at or adjacent to de novo SVs. Log2 fold RNA expression changes compared to controls (see the “Methods” section) determined by RNA sequencing for expressed genes (RPKM > 0.5) that are located within 2 Mb of SV breakpoint junctions (FLANK) or that are inverted (INV), duplicated (DUP), deleted (DEL), or truncated (TRUNC). Differentially expressed genes (p < 0.05, calculated by DESeq2) are displayed in red

