Figure 4.

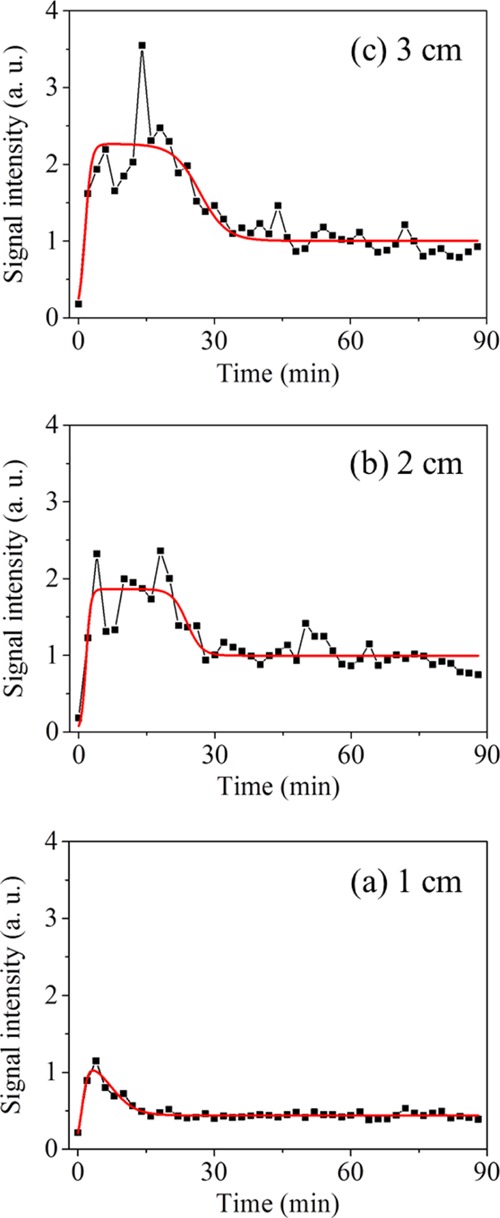
Averaged time profiles of the peak areas of styrene in an O/W emulsion (black plots and lines). Heights of the monitoring positions from the bottom: (a) 1, (b) 2, and (c) 3 cm. Fit results are also shown (red lines).

Averaged time profiles of the peak areas of styrene in an O/W emulsion (black plots and lines). Heights of the monitoring positions from the bottom: (a) 1, (b) 2, and (c) 3 cm. Fit results are also shown (red lines).