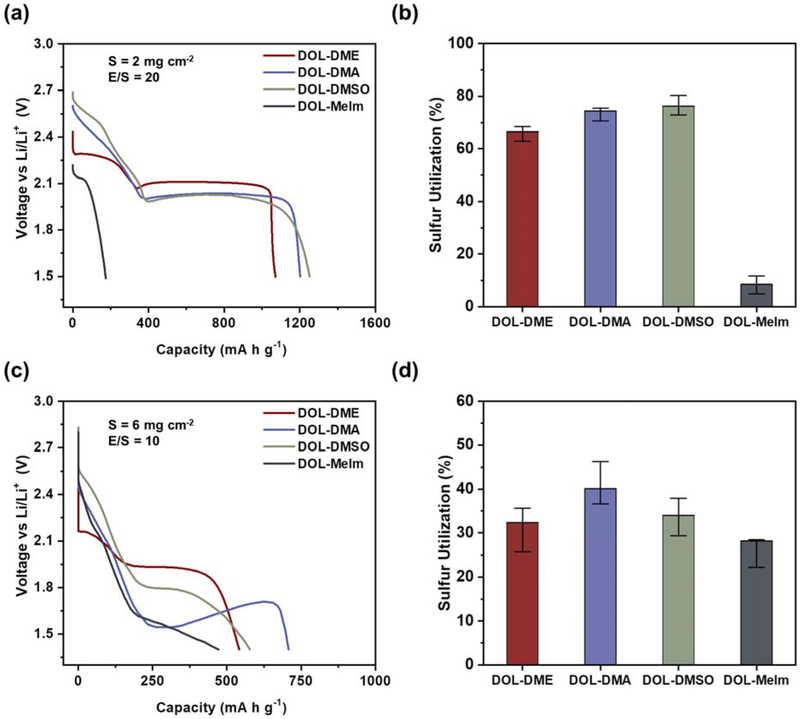
Figure 3.
(a) First cycle discharge profiles of 2 mg cm−2 sulfur cathode obtained for a sulfur cathode in 4 different electrolytes, where the solvents of interest are used with 50% DOL and 1 M LiTFSI. (b) Bar graph showing median utilizations obtained at 2 mg cm−2, along with the range of values observed. (c) First cycle discharge profiles of 6 mg cm−2 sulfur cathode. (d) Median utilizations obtained for 6 mg cm−2 cathodes, along with the range of values observed.

