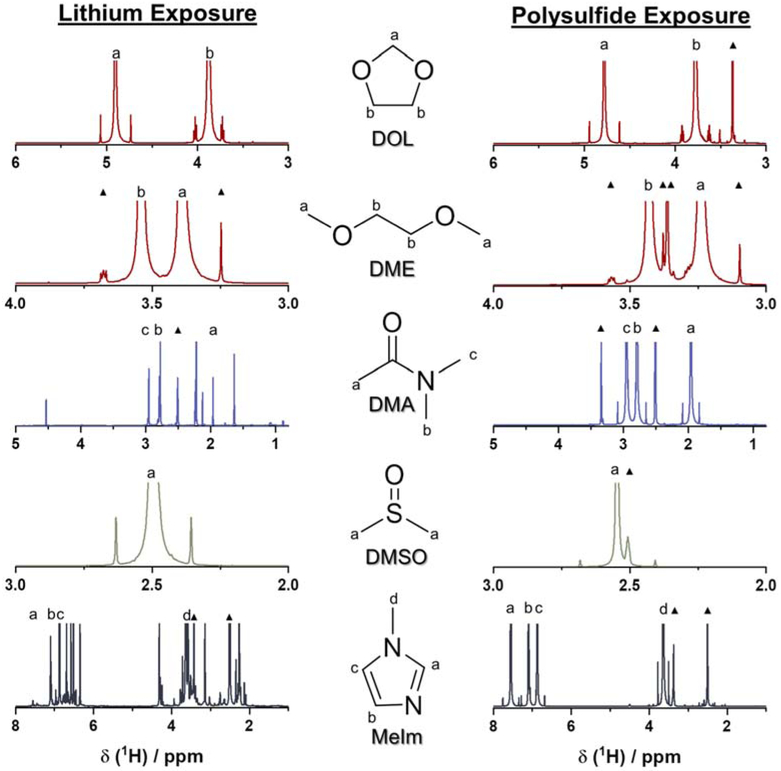
Figure 5.
1H-NMR spectra of each of the solvents under investigation after exposure to lithium metal for one week (left) and dissolved polysulfides for 30 days (right). Hydrogens associated with each peak are labelled on each solvent molecule as well as on the spectra themselves. Unlabeled peaks correspond to suspected decomposition products. The symbol “▲” accompanies peaks corresponding to known contaminants, unaffiliated with suspected side reactions. [33]

