Fig. 6.
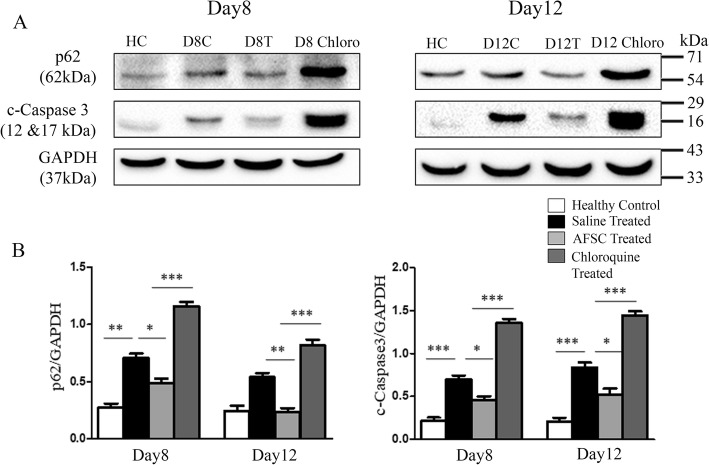
Effect of chloroquine administration on autophagy and apoptosis. a Representative immunoblots showing the expression of autophagic marker p62 and apoptosis marker cleaved caspase-3 in kidney tissues of healthy control, saline-treated, AFSC-treated, and chloroquine-treated groups on day 8 and day 12 after cisplatin injection. b Bar diagrams showing semi-quantitative densitometric analysis for comparison of expression of p62 and cleaved caspase-3 by referring each gene to GAPDH which was taken as internal control. Values expressed as mean ± SE of three independent blots (*p < 0.05, **p < 0.01, ***p < 0.001)

