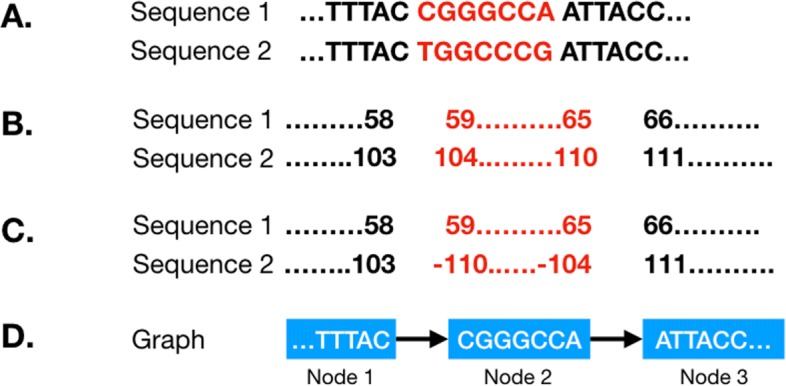
Fig. 2.

Representation of inversions in the genome graph. During the first step of genome graph creation, co-linear blocks are identified. In some cases, these may be homologous sequences that have been inverted. GenGraph represents these sequences in a single node (that may be broken down into more nodes in the second step) and represents the inverted state of the sequence by negative nucleotide position values in the node. a, Two sequences are shown where an inversion has taken place. This is normally a larger stretch of sequence perhaps a few kb in length. b, The positions of the sequences are different, as is generally the case with homologous sequences. The positions of the nucleotides flanking the breakpoints are shown. c, The inversion in the second sequence is represented by reversed negative nucleotide position values. d, This way, both sequences are represented in the same node, and to recreate sequence 2, the sequence in the node is simply reverse-complimented
