Fig. 1.

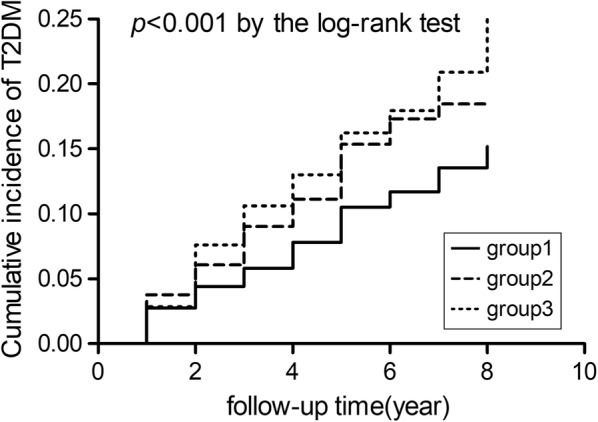
Kaplan–Meier survival analysis K–M curves for T2DM among three TG levels. †Groups of TG were defined as follows: 1, < 150 mg/dL (normal); 2, 150 mg/dL-199 mg/dL (borderline high); 3, 200–499 mg/dL (high); *P-value < 0.01 for log-rank test

Kaplan–Meier survival analysis K–M curves for T2DM among three TG levels. †Groups of TG were defined as follows: 1, < 150 mg/dL (normal); 2, 150 mg/dL-199 mg/dL (borderline high); 3, 200–499 mg/dL (high); *P-value < 0.01 for log-rank test