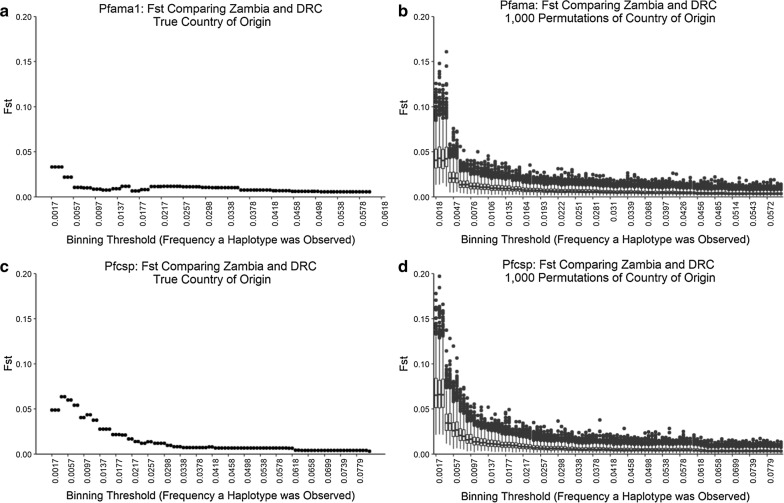
Fig. 6.
a, b For each of 100 randomly selected binning threshold (X-axis) ranging from the minimum to the maximum haplotype frequencies for each amplicon (a Pfama1, b Pfcsp), we classified parasites as rare or not, subset the data to include only rare parasites, and calculated FST (Y-axis) between Zambia and the DRC using only the subset data. c, d To test whether the reduced sample size was driving patterns in FST we randomly permuted the country of origin for each sample 1000 times. For each permutation, we subset the data to include only rare samples based on each binning threshold, and calculated FST comparing Zambia and the DRC. Boxplots show the range of FST estimates across the 1000 permutation replicates for Pfama1 (c) and Pfcsp (d)

