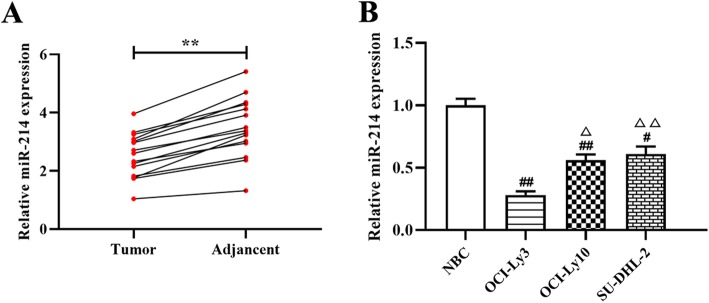
Fig. 1.
The expression of miR-214 in DLBCL tissues and cell lines. a and b—Quantitative RT-PCR was used to determine the expression levels of miR-214 in DLBCL tissues (a) and cell lines (b). **p < 0.01, compared with the adjacent normal tissues; #p < 0.05, ##p < 0.01, compared with the normal B-cell line (NBC); △p < 0.05, △△p < 0.01, compared with the OCI-Ly3 cells

