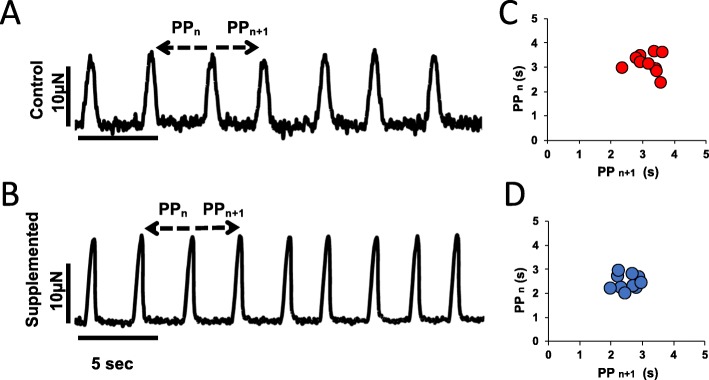
Fig. 12.
Twitch tracings under spontaneous beating. Representative twitch tracings of hCM-only control hECT (a) and hCSC-supplemented hECT (b); arrows point to measurements performed for each pair of consecutive twitches, PPn = time to previous, and PPn + 1 = time to next. Corresponding Poincaré plots show the clustering of values according to the difference between each twitch in the time domain for hCM-only control hECTs (c) and hCSC-supplemented hECTs (d)

