Fig. 2.

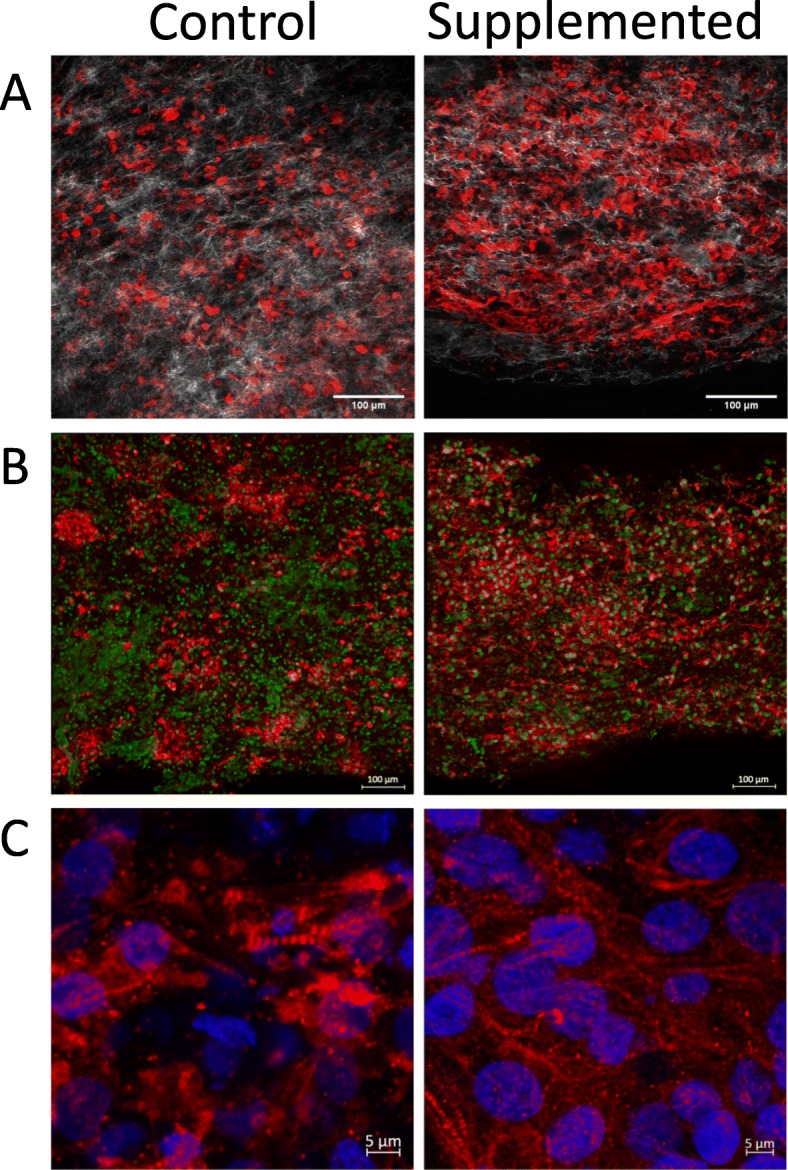
Organization and microstructure of hECTs. Representative microscopy images of hECTs obtained along the horizontal axis of the hECT. a Single slice image obtained on a two-photon microscope, showing alpha-actinin (red) and collagen fibers (white), scale bar = 100 μm. b Confocal max projection showing Cardiac Troponin T (red), and nuclei stained with anti-histone H2B (green), scale bar = 100 μm. c Confocal max projection showing myofibril organization, with cardiac Troponin T (red), and nuclei stained with DAPI (blue,) scale bar = 5 μm
