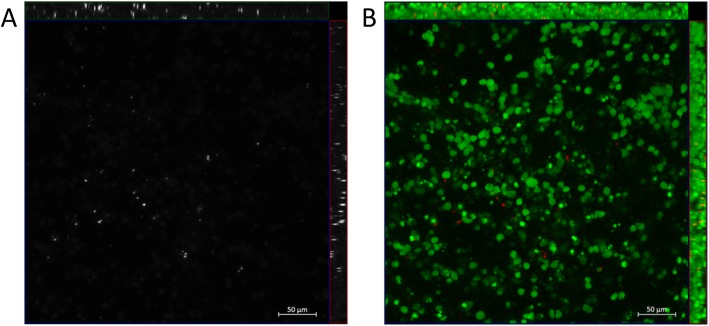
Fig. 3.
Distribution of hCSC within the hECTs. Representative image of hCSC-supplemented hECT fabricated with hCSCs that were labeled with Qtracker-655 prior to tissue fabrication. Confocal max projection with orthogonal projections in a grayscale image, Cy5 channel only, showing Qtracker-655-labeled cells (white), and b merged image showing Qtracker-655-labeled cells (pseudocolored red) and nuclei stained with DAPI (pseudocolored green)

