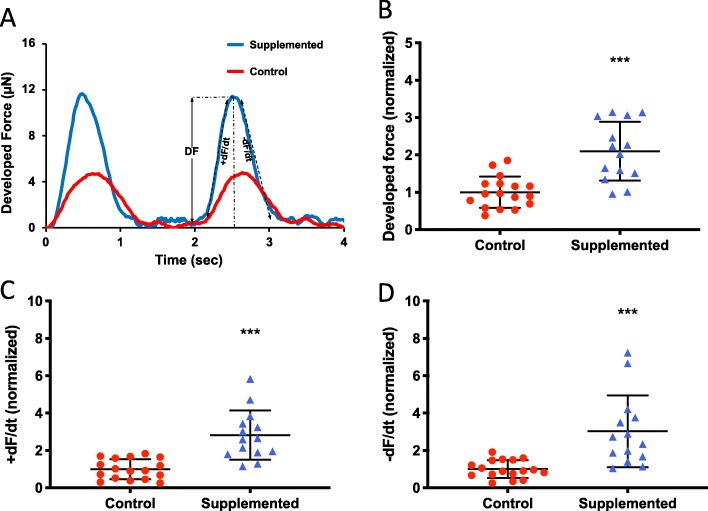
Fig. 4.
Twitch parameters under electrical stimulation. a Example twitch tracings for hCM-only control (red circle) and hCSC-supplemented hECTs (blue triangle) at 0.5-Hz electrical stimulation, illustrating the metrics of developed force (DF), rate of contraction (+dF/dt), and rate of relaxation (−dF/dt). b Developed force, c rate of contraction, and d rate of relaxation, were significantly higher in hCSC-supplemented (n = 17) vs. control (n = 14) hECTs. Measurements performed at 0.75-Hz pacing, and values normalized to mean control hECTs. Dot plots show individual data with bars representing mean ± SD; *** p < 0.001

