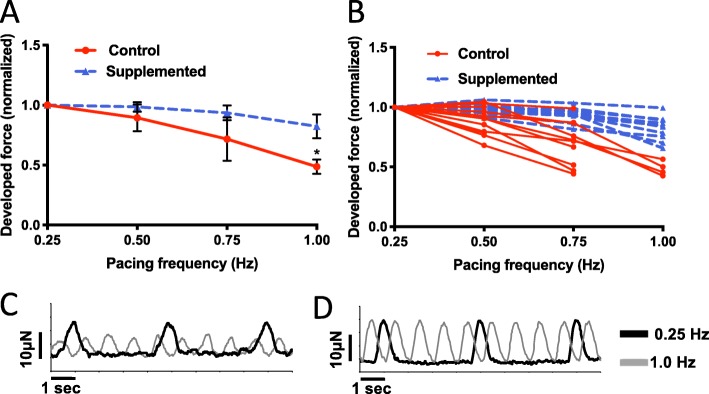
Fig. 6.
Force-frequency relationship. a Force-frequency response normalized to 0.25-Hz baseline for individual hECTs, with mean ± SD for control (red circle, n = 13) and hCSC-supplemented (blue triangle, n = 10) hECT groups. The regression slope for control hECTs was different from zero (p = 0.013) whereas the hCSC-supplemented slope was not (p = 0.067). b Force-frequency response of individual hECTs from hCM-only control (solid lines) and hCSC-supplemented (dashed lines) groups. hECTs that lost 1:1 capture below 1.0 Hz are indicated by abbreviated curves. c, d Example twitch tracings for hCM-only control (c) and hCSC-supplemented (d) hECTs at 0.25-Hz (black line) and 1.0-Hz pacing (gray line)

