Fig. 7.
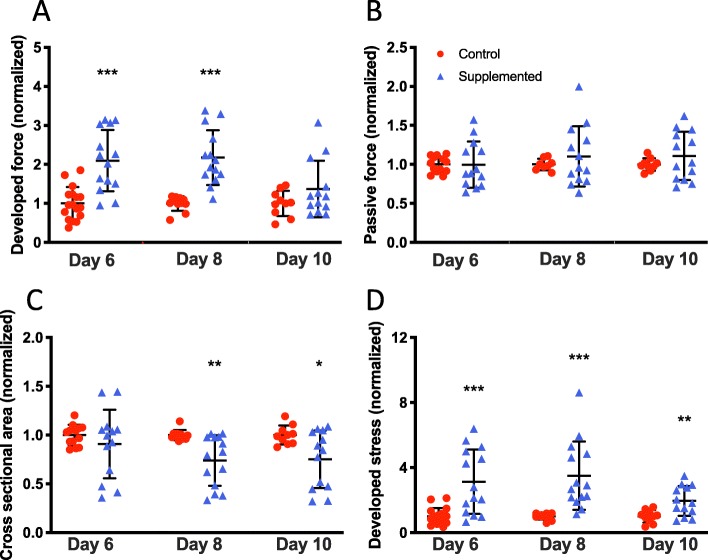
Time course of hECT twitch force. a Developed force at 0.75-Hz pacing at 6, 8, and 10 days after tissue fabrication for hCM-only control hECT (red circle) and hCSC-supplemented hECT (blue triangle). b Corresponding passive (diastolic) force from the same twitches analyzed for panel a. c Cross-sectional area of the hECT calculated from tissue diameter measured by digital image analysis immediately before twitch testing. d Developed stress (force/area) calculated from data in panels a and c. Dot plots show individual data with bars representing mean ± SD; all values normalized to mean hCM-only control at corresponding time point; *p < 0.05, **p < 0.01, ***p < 0.001

