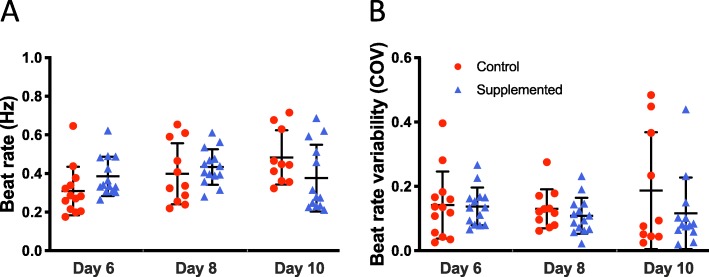
Fig. 8.
Intrinsic beat rate characteristics. a Spontaneous beat rate of hECTs on days 6, 8, and 10 after tissue fabrication. b Beat rate variability (measured as coefficient of variation, COV), at the same three time points. Dot plots show individual data with bars representing mean ± SD; n = 13, 11, 10 for hCM-only control hECT (red circle) and n = 14, 14, 13 for hCSC-supplemented hECT (blue triangle) on days 6, 8, and 10, respectively

