Fig. 9.
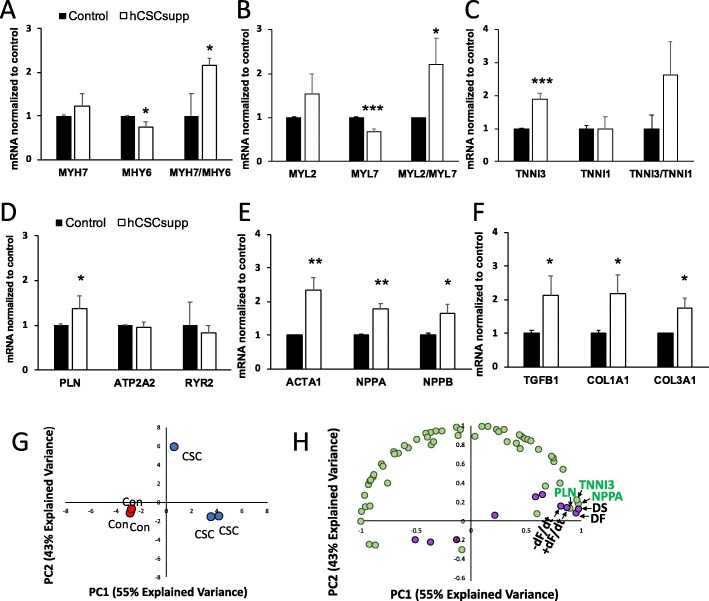
Gene expression analysis. Results from Nanostring Gene Assay, presented as mRNA transcript level in hCSC-supplemented hECTs (white bars) normalized to hCM-only controls (black bars) for genes associated with cardiac development/maturation (a, b, c), calcium handling (d), cardiomyogenic genes activated in response to stress (e), and extracellular matrix regulation (f). Bars represent mean ± SD; n = 3 hECT per group, *p < 0.05, **p < 0.01, ***p < 0.001. g Principal component analysis; red marks indicate hCM-only control (CON), blue marks indicate hCSC-supplemented hECTs (hCSCs) (n = 3 hECT per group). h Correlation loading plot from partial least squares regression suggests several significantly upregulated genes or downregulated genes that covary with hECT developed force, developed stress, +dF/dt, and −dF/dt (R 0.92); genes indicated by green markers, twitch parameters indicated by purple markers. DF = developed force, DS = developed stress, +dF/dt = maximum rate of contraction, and −dF/dt = maximum rate of relaxation

