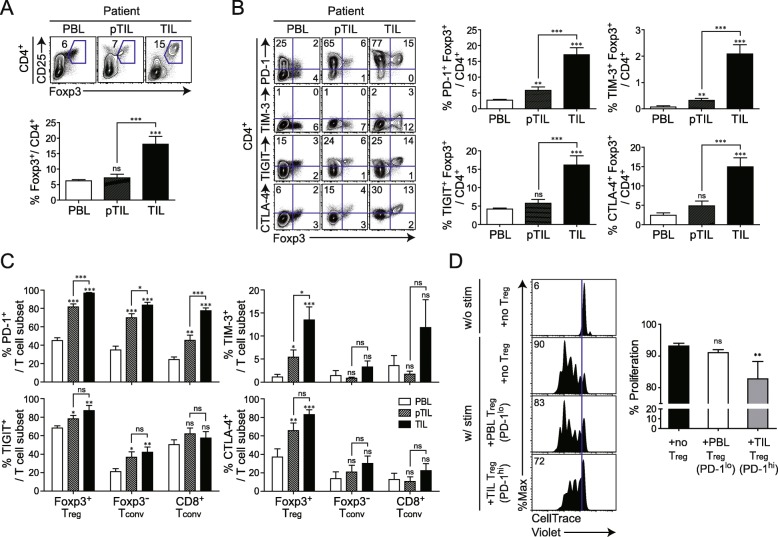
Fig. 3.
PD-1-expressing tumor-infiltrating Treg and their activated phenotype in patients with non-small cell lung cancer (NSCLC). a CD25 and Foxp3 expression in CD4+ T cells (upper) and proportion of Foxp3+ cells among total CD4+ T cells (lower) in peripheral blood lymphocytes (PBLs), peritumoral infiltrating lymphocytes (pTILs), and tumor-infiltrating lymphocytes (TILs) derived from patients with NSCLC. b Representative plots of PD-1, TIM-3, TIGIT, CTLA-4, and Foxp3 expression in CD4+ T cells (left) and percentage of CD4+ T cells co-expressing PD-1, TIM-3, TIGIT, CTLA-4, and Foxp3 (right). c PD-1, TIM-3, TIGIT, and CTLA-4 expression in Foxp3+ Treg, Foxp3− Tconv and CD8+ Tconv of these patients. d Enhanced suppression of CD8+ T cells by PD-1-expressing tumor-infiltrating Treg from NSCLC patients. Treg were isolated from the peripheral blood and tumor tissue from NSCLC patients. Peripheral blood Treg and tumor-infiltrating Treg expressed low and high levels of PD-1, respectively. CellTrace Violet (CTV)-labeled CD8+ T cells were stimulated in vitro with CD3/CD28 Dynabeads for 96 h in the absence or presence of each Treg population. CTV dilution in proliferating CD8+ T cells is indicated in each histogram. Histograms represent the percentages of proliferating cells. Lines in the bar graph represent the mean and mean ± SEM, respectively. ns, not significant; **P < 0.01, ***P < 0.001 (Mann-Whitney test)

