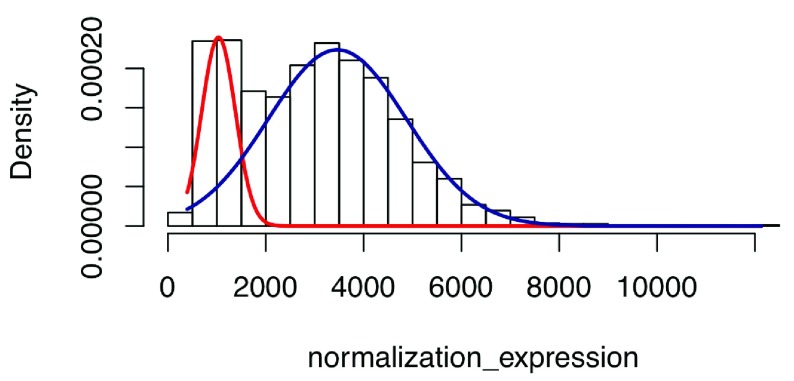
Figure 10. The Gaussian mixture model is implemented here to filter out noise.
Hist plot shows the distribution of gene expression level for gene ‘CELSR2’ in 1671 different brain RNA-Seq samples. The Gaussian mixture model is fitted by the EM algorithm and the noise is filtered out by posterior probability bigger than 0.5.

