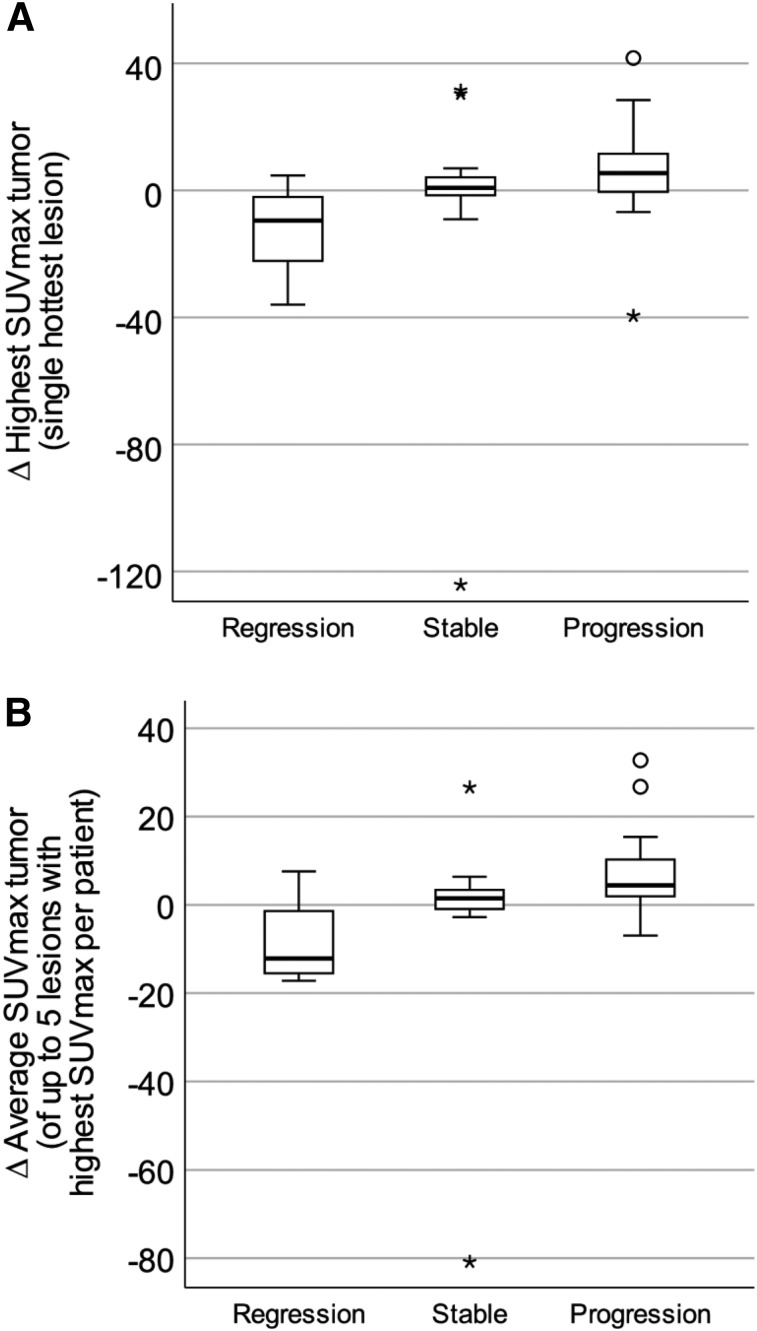
FIGURE 4.
Box plots of differences (∆) in highest SUVmax in tumor (P = 0.022) (A) and in average SUVmax in tumor (P = 0.004) (B) related to disease status at second examination with 68Ga-DOTATATE/PET/CT. P < 0.05 on Kruskal–Wallis testing was considered statistically significant. Small significant differences were found.

