Abstract
The main finding of this paper is that the human visual cortex responds in a very nonlinear manner to the color contrast of pure color patterns. We examined human cortical responses to color checkerboard patterns at many color contrasts, measuring the chromatic visual evoked potential (cVEP) with a dense electrode array. Cortical topography of the cVEPs showed that they were localized near the posterior electrode at position Oz, indicating that the primary cortex (V1) was the major source of responses. The choice of fine spatial patterns as stimuli caused the cVEP response to be driven by double-opponent neurons in V1. The cVEP waveform revealed nonlinear color signal processing in the V1 cortex. The cVEP time-to-peak decreased and the waveform's shape was markedly narrower with increasing cone contrast. Comparison of the linear dynamics of retinal and lateral geniculate nucleus responses with the nonlinear dynamics of the cortical cVEP indicated that the nonlinear dynamics originated in the V1 cortex. The nature of the nonlinearity is a kind of automatic gain control that adjusts cortical dynamics to be faster when color contrast is greater.
Keywords: human color vision, cVEP, V1, cortical dynamics
Introduction
Twenty-first century visual neuroscience has revealed that the primary visual cortex, V1, plays a crucial role in the spatial transformation of color signals (Conway et al., 2010; Hurlbert & Wolf, 2004; Jansen et al., 2014; Johnson, Hawken, & Shapley, 2001), rather than having all important color computations deferred until later stations in the cerebral cortex as had been proposed (Zeki, 1983). It makes functional sense that neural computations for color perception should take place early in cortical processing where the spatial layout of the scene is preserved in V1's precise visuotopic map (Wandell & Winawer, 2011). The reason is that, for veridical color perception, the neural mechanisms of color perception must make computations that take into account the spatial layout of the visual scene as well as the spectral reflectances of different surfaces (Brainard, 2004). But there also are likely to be further color computations at higher cortical levels; it seems likely that V1 and inferotemporal cortex (in macaques) cooperate in color perception (for instance Conway, Moeller, & Tsao, 2007; Harada et al., 2009; Komatsu, 1998).
We investigated the color responses of neuronal populations in human V1 cortex by measuring the chromatic visual evoked potential (cVEP; Crognale, 2002; Crognale, Duncan, Shoenhard, Peterson, & Berryhill, 2013; Murray, Parry, Carden, & Kulikowski, 1987; Rabin, Switkes, Crognale, Schneck, & Adams, 1994; Souza et al., 2008) over a wide range of color contrast. The cVEP's very fine temporal resolution was critically important for understanding response dynamics in cortical color-responsive regions. Evidence that the cVEP reflects V1 color-evoked activity comes from the signal's topography on the scalp, lack of attentional effects, and experiments on cerebral achromatopsia (see Discussion). One important fact about the cVEP is that it is tuned for spatial frequency. The cVEP amplitude is much smaller for lower spatial frequencies than it is at its peak spatial frequency, between 1–2 cycles per degree (CPD), a consistent result across many studies of cVEP (Murray et al., 1987; Porciatti & Sartucci, 1996; Rabin et al., 1994; Tobimatsu, Tomoda, & Kato, 1995). Taken together with results from single-cell recording in primates (Johnson et al., 2001; Schluppeck & Engel, 2002), the spatial tuning of the cVEP suggests it is mainly driven by V1 double-opponent cells that also are spatially tuned. Unlike double-opponent cells, cortical single-opponent cells respond best to patterns of low spatial frequency or to uniform fields of color (Johnson et al., 2001; Lennie, Krauskopf, & Sclar, 1990; Shapley, Hawken, & Johnson, 2014; Thorell, de Valois, & Albrecht, 1984). Therefore, we designed our experiments to favor the double-opponent cVEP signal by using fine color-checkerboard patterns that were equiluminant with the background gray.
The cVEP waveform exhibited nonlinear dynamics over the range of color contrast we studied. As reported before (Crognale et al., 1993; Porciatti & Sartucci, 1996; Rabin et al., 1994; Souza et al., 2008), we observed a very large reduction in cVEP latency with increasing color contrast. However, even more remarkable was the change in cVEP waveform shape with increasing color contrast, as analyzed in Results. The nature of the nonlinear change of waveform with color contrast suggests that in the human primary visual cortex there is an automatic gain control for color contrast similar in function to the previously studied (achromatic) contrast gain control for luminance contrast (Carandini, Heeger, & Movshon, 1997; Gomes et al., 2010; Ohzawa, Sclar, & Freeman, 1982). The functional implication is that the cortex adjusts its gain and also its dynamics of response to the color contrast in the visual scene.
Methods
Participants
All observers gave informed consent to participate in this study. The experiments were conducted in accordance with the principles embodied in the Declaration of Helsinki and were approved by the Hunter College/City University of New York and the New York University Institutional Review Boards.
Ten observers (four male, six female) aged 19 to 48 (M = 26, SD = 9) participated in this experiment. All participants had normal color vision, assessed with the 18-plate series Pseudo-isochromatic Plates for Testing Color Perception compiled in 1940 by the American Optical Company (Buffalo, NY); Farnsworth dichotomous test for color blindness – Panel D15 (The Psychological Corporation, New York, NY); Lanthony's desaturated 15 hue test (Luneau Ophtalmologie, Chartres, France); and the Farnsworth-Munsell 100-hue test for color vision (Munsell Color Corporation, Baltimore, MD). The participants also had at least 20/20 (or corrected to 20/20) visual acuity, measured using a Snellen chart at 114 cm (the distance to the screen during experiments).
Visual stimuli
A Sony PVM-1741A OLED monitor (Sony Corporation, New York, NY) was used to present the stimuli. The monitor had a diagonal screen size of 42 cm, resolution of 1920 × 1080 and vertical refresh rate of 60 Hz. The screen was calibrated using a Photo Research PR670 Spectrascan radiometer/photometer (Photo Research, Chatsworth, CA), and this was used to calculate a gamma correction to linearize the screen output to ensure complete control of the intensities on the screen.
The stimulus size was 20 × 20 cm which at a distance of 114 cm corresponded to 10° × 10° of arc subtended at the eye. The stimuli were equiluminant (using textbook values of equiluminance; Wyszecki & Stiles, 1982) color checkerboards that were rectangular-wave modulated from a gray background to color and back to gray (0.5 s on, 1.5 s off; i.e., modulated at 0.5 Hz with a duty cycle 0.25)—so-called appearance-disappearance modulation (illustrated in Figure 1). The spatiochromatic stimulus was chosen to be a checkerboard so that participants could perceive a definite color in the colored checks for hue and saturation scaling experiments (Gordon, Abramov, & Chan, 1994) done in parallel, the results of which will be reported elsewhere. The checkerboard had 32 × 32 checks. Therefore, each check spanned 0.3125° of arc, for which the dominant spatial frequency has a period of 0.3125 × √2 = 0.4419°, giving a dominant spatial frequency of 1/0.4419 = 2.26 cycles per degree, near the peak of the spatial frequency response reported by Rabin et al. (1994). A given stimulus was presented repeatedly in a block of 30 trials (lasting a total of 60 s).
Figure 1.
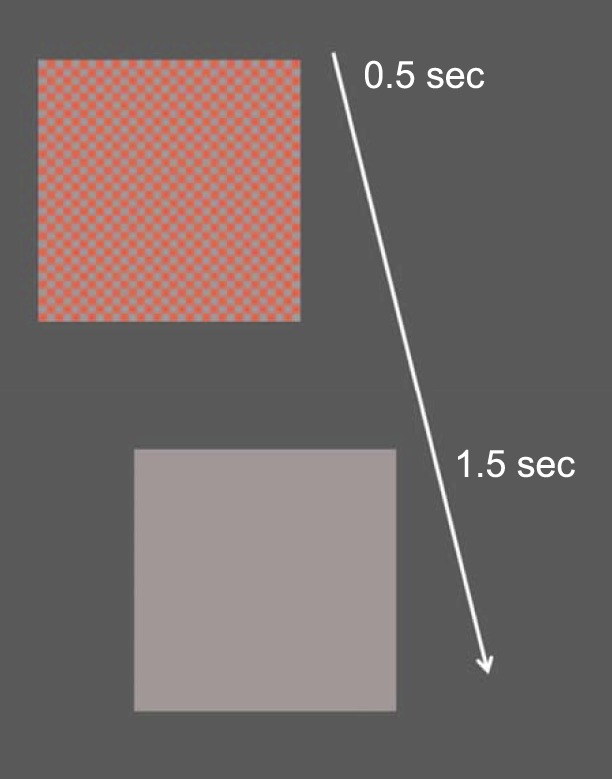
Representation of the appearance/disappearance stimulus with time. For 0.5 s, a checkerboard of squares was visible. In the checkerboard, squares of equiluminant red of a specific cone contrast alternated with squares that were gray like the background. This “on” pattern consisted of 32 × 32 squares covering 10° × 10° of arc subtended at the eye, and was followed by an interval of 1.5-s duration during which the entire screen was uniform gray (“off”). The transition between “on” and “off” patterns occurred suddenly; thus, the temporal modulation signal was a rectangular wave. All checks and the background were the same luminance.
The background gray color corresponded to a color temperature of 5800°K and had CIE xy coordinates [0.324, 0.328]. The pattern color was one of six saturation-levels of red, with chromatic root mean square (RMS) cone contrast ranging from 0.03 to 0.40. The highest saturation red checks had CIE coordinates [0.522, 0.336]. The chromatic excitation purities and CIE coordinates of each of the color contrasts used are provided in Table 1. For all stimuli the luminance was 31 cd/m2.
Table 1.
RMS cone contrast and corresponding color excitation purity (CEP) and CIE color coordinates for each stimulus presented.
| Cone contrast |
Color excitation purity |
CIE color coordinates |
|
|
x |
y |
||
| 0.028 | 0.051 | 0.334 | 0.335 |
| 0.086 | 0.133 | 0.363 | 0.335 |
| 0.130 | 0.196 | 0.384 | 0.336 |
| 0.180 | 0.264 | 0.408 | 0.336 |
| 0.270 | 0.399 | 0.454 | 0.337 |
| 0.400 | 0.593 | 0.522 | 0.336 |
Stimulus presentation was controlled using the Psychophysics Toolbox extensions (Brainard, 1997; Kleiner et al., 2007; Pelli, 1997) for Matlab R2012b (The MathWorks, Inc., Natick, MA), which ran on a Dell Inspiron-3847 computer using the Microsoft Windows 7 operating system. To ensure tighter control of timing, particularly for changing images on the screen from one frame to the next, we followed methods similar to those proposed by Scarfe (n.d.). A trigger signal was sent via serial port to the recording system directly before each stimulus was presented. There was a very small constant delay between the trigger and stimulus signals, which did not cause signal jitter and was taken into account when calculating the pre- and poststimulus periods.
During each experiment the participants were seated such that their eye level was aligned with the center of the screen and the viewing distance was 114 cm. Stimuli were viewed binocularly. There was one block of stimulus presentations for each cone contrast and the blocks were presented in random order. Each participant was asked to focus on the center of the screen, and to blink as little as possible, particularly when a stimulus was visible on the screen.
Data acquisition
Data were recorded using a BioSemi ActiveTwo system (BioSemi, Amsterdam, Netherlands); with 64 electrodes we obtained the spatial resolution of a 128-channel system by positioning 63 electrodes on the back half of a 128-channel BioSemi electrode cap set up with the extended 10–20 system (based on the Oostenveld and Praamstra 5% System; Oostenveld & Praamstra, 2001). One electrode was positioned at Fpz and all data were re-referenced to Fpz after data acquisition. When aligning the electrode cap, we ensured that the electrode for Oz was correctly positioned at 10% of the inion-nasion distance along the midline of the scalp (see Figure 2 for a diagram showing the electrode placement). The trigger and electroencephalogram (EEG) signals were sampled at a frequency of 2048 Hz, with an open passband from 0–400 Hz.
Figure 2.
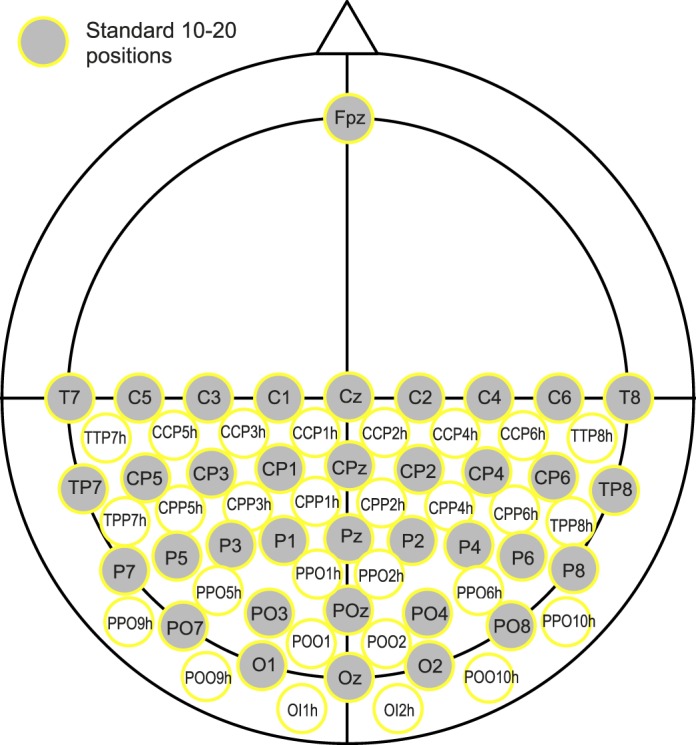
Expanded 10–20 electrode placements used on the BioSemi 128-channel head cap, based on the Oostenveld and Praamstra 5% system (Oostenveld & Praamstra, 2001). Image based on figure originally provided by Cortech Solutions, Inc. (adapted with permission).
Data analysis
Using functions from the FieldTrip toolbox for EEG/MEG-analysis (Oostenveld, Fries, Maris, & Schoffelen, 2011; http://www.ru.nl/neuroimaging/fieldtrip), we imported the response data for each stimulus and separated them into trials containing a prestimulus period of 100 ms and post-stimulus-onset period of 500 ms.
The EEG data in each trial were re-referenced with respect to electrode Fpz, and then were baseline corrected with respect to the average voltage across each entire trial. The data were inspected visually (all channels simultaneously on a trial-by-trial basis) to remove blinks and artifacts due to movement or extreme electronic noise transients (greater than 150 μV). At this point, the trial data were baseline-corrected with respect to the prestimulus period before a Discrete Fourier Transform of the cVEP waveform was calculated using a period of 0.5 s, covering the duration of the stimulus. This resulted in a Fourier fundamental frequency of 2 Hz. Note that we chose not to conduct Fourier analysis over the whole stimulus on/off period because our purpose was strictly to focus on the waveform shape over the time when the stimulus was visible. This was partly because the participants tended to blink more after the stimulus disappeared but mainly because the nonlinear dynamics in which we are interested were in this range. The first 100 Fourier harmonics were used to construct inverse FT waveforms. Before the reconstruction step, the data were filtered for 60 Hz noise and its harmonics by setting the amplitudes of the corresponding harmonics to zero. No additional filtering, including any high-pass band filtering, took place.
Results
cVEPs: Waveforms and topography
The cVEP waveforms were predominantly negative deflections, consistent with earlier reports (Crognale, 2002; Crognale et al., 2013; Murray et al., 1987; Rabin et al., 1994; Souza et al., 2008). At high cone contrast, the cVEP had a large negative peak occurring around 120–150 ms after stimulus onset (Figure 3) replicating what has been reported before about the timing of the cVEP peak and its polarity (Murray et al., 1987; Porciatti & Sartucci, 1996; Rabin et al., 1994; Tobimatsu et al., 1995). Figure 3 depicts the cVEPs of one participant over a range of cone contrasts to illustrate cVEP dependence on cone contrast and the magnitudes of cVEPS.
Figure 3.
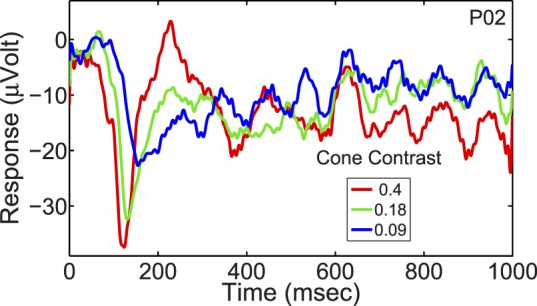
The cVEP waveform of one participant for a selection of cone contrasts, covering the time period from pattern onset to 1 s after pattern onset. Note that the pattern was visible only from 0–0.5 s. For this particular participant, there was very little off-response and the waveform after the pattern disappeared was mostly reflective of stimulus-entrained alpha. The peak-baseline negativity at maximum cone contrast for the participants ranged from 12 to 53 μV (M = 26.6 μV, SEM = 3.6 μV).
The cVEP was recorded with a dense multi-electrode array (see Methods) from which we could estimate the regions of the cerebral cortex activated by the spatiochromatic stimulus. Figure 4 from one participant shows the electrode topography of the cVEP as a function of time at two values of cone contrast: 0.09 (low cone contrast) and 0.4 (moderately high cone contrast). The cartoon provided by the manufacturer, reproduced in Figure 2, indicates the electrode locations on the head and their conventional designations (e.g., Oz for the most posterior midline electrode). As can be seen in Figure 4, cVEP activation at high contrast peaked over Oz at the peak time of 115 ms. At later times 155 and 175 ms, the cVEP extended laterally to the neighboring electrodes. At high contrast, at the peak time of the cVEP there was no significant activation either of lateral occipital cortex or parietal cortex by the appearance/disappearance of pure color checkerboards. The data at lower contrast were different. At an early time (135–155 ms) prepeak the active region was confined to Oz. But then at 175 ms the activity spread, encompassing both Oz and more lateral posterior electrodes. It is quite remarkable how the topographic pattern changed dramatically with cone contrast. This is one definite indicator of how the cortical response to cone contrast is nonlinear, not simply scaling in amplitude with cone contrast. Cortical topographic data like those in Figure 4 were found in all participants whose results are used in this paper. This supports the hypothesis that most of the cortical activity we studied was generated primarily within primary visual cortex, V1.
Figure 4.
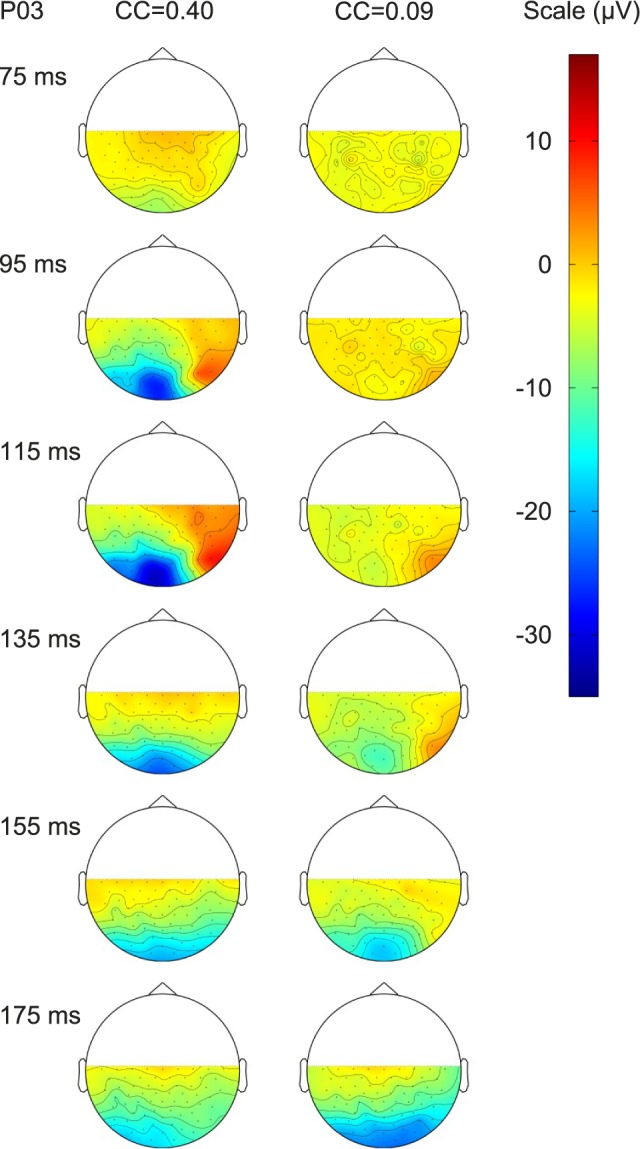
Series of topographic maps of the responses over the head, as viewed from above, for one participant, at several different times after stimulus onset, for two different cone contrasts (0.4 on the left and 0.09 on the right). In each topographic plot, the color contours join areas with the same response magnitude. While the responses were only measured at specific electrode positions, the values between electrodes were calculated by interpolation. The range of response voltages (in μV) is given by the scale to the right. The actual electrode locations are indicated in Figure 2.
cVEPs: Nonlinear dynamics with color contrast
Unlike the color-evoked responses measured in subcortical parvocellular- and koniocellular-pathway neurons (discussed below), the cVEP generated in V1 exhibited nonlinear dynamics in responses to different cone contrasts (Figures 3 and 5). Figure 5 depicts cVEP at higher temporal resolution data than those in Figure 3, with data from two other participants.
Figure 5.
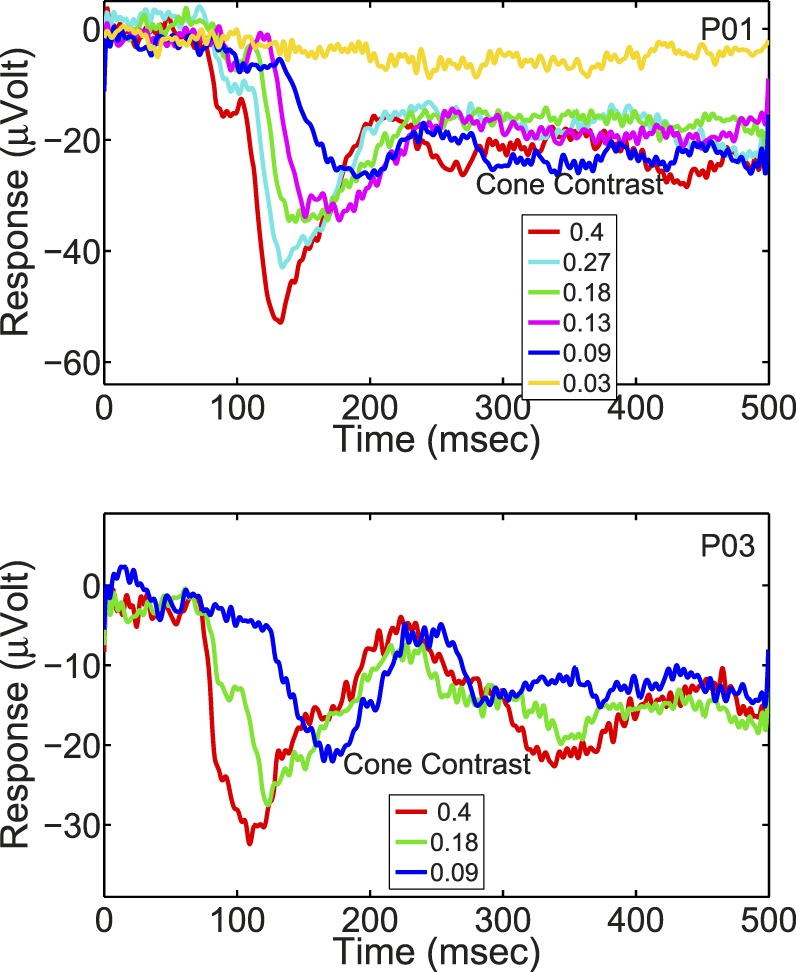
The cVEP waveforms of two participants for a range of cone contrasts covering the time period from pattern onset to 0.5 s after pattern onset.
To emphasize the waveform's shape instead of its amplitude, we drew Figure 6 in which all the cVEP waveforms are normalized at (negative) peak to the same value (−1). Then the waveform differences at different cone contrasts are quite vivid. As seen in Figure 6, the cVEP for lower cone contrast was (a) slower to rise (Crognale et al., 1993; Porciatti & Sartucci, 1996; Rabin et al., 1994; Souza et al., 2008) and also (b) more prolonged than at higher contrast. These two effects of nonlinear dynamics can be observed qualitatively in the waveforms in Figure 6 as (a) the shift to the left of the waveforms of responses to higher contrast, and (b) the crossing of lower contrast responses by higher contrast responses (i.e., earlier decline to baseline of responses to higher contrast). For instance, note that the responses to 0.18 cone contrast drawn in green, cross the response to 0.09 cone contrast drawn in blue around 170 ms in the upper panel and around 190 ms in the lower panel. This waveform crossing is a qualitative indication of the longer persistence of the response at lower cone contrast. We analyzed these nonlinear dynamics further in a number of ways.
Figure 6.
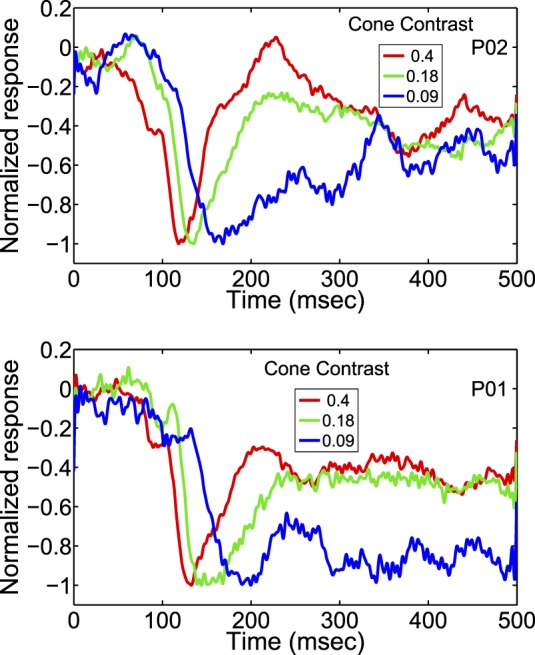
The normalized cVEP responses of two participants for a range of cone contrasts covering the time period from pattern onset to 0.5 s after pattern onset. The original cVEP waveforms were normalized at (negative) peak to the same value (−1).
First, we replicated the shorter latency of cVEP at higher contrast (Crognale et al., 1993; Crognale, Switkes, & Adams, 1997; Porciatti & Sartucci, 1996; Rabin et al., 1994; Souza et al., 2008) by Fourier analyzing the cVEP waveform as described in the Methods section. The largest harmonic amplitude was usually at 4 Hz, so we analyzed the phase shift of the 4-Hz component in the Fourier transform of the cVEP. Results for one typical participant and an average across all participants are given in Figure 7. The individual's data and the pooled data are completely consistent in showing a very large phase advance, greater than or equal to 100° of phase, from low to high cone contrast, replicating the many previous studies that found decreasing latency with increasing cone contrast.
Figure 7.
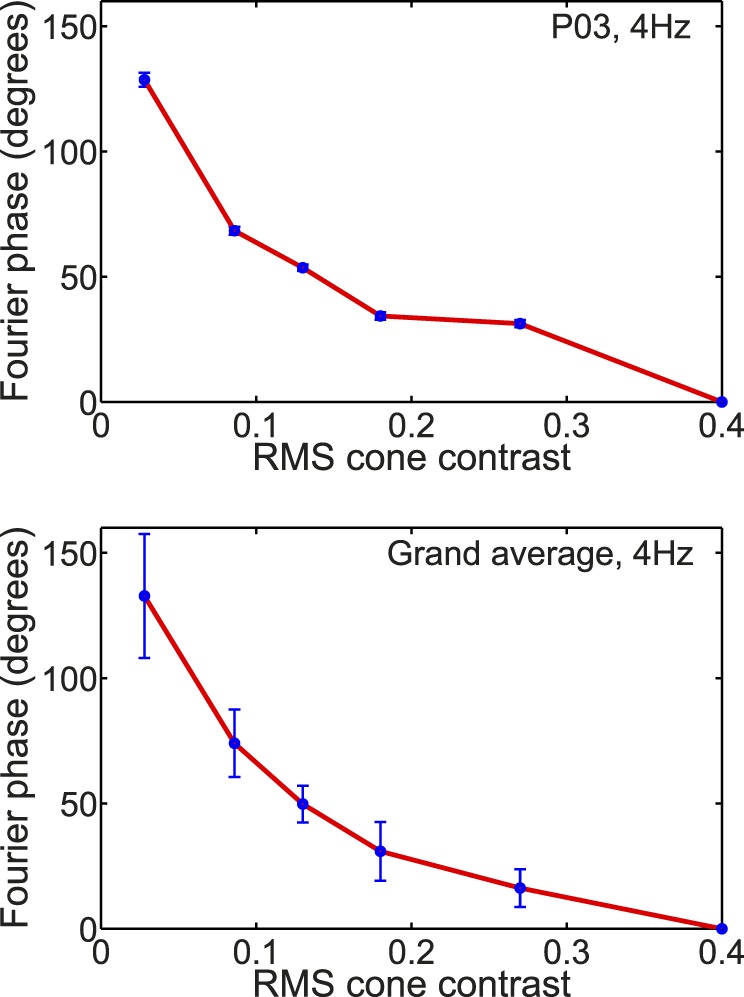
The phase of the 4 Hz component in the Fourier transform of the cVEP plotted as a function of RMS cone contrast for a typical participant (top) and averaged across all participants (bottom). In the graph for a single participant (top), error bars were calculated from the Tcirc2 statistic of Victor and Mast (1991). For the grand average (bottom) the error bars represent ±1 SEM.
To reinforce that there were qualitative differences in cVEP waveform, we did a more quantitative analysis by analyzing the Fourier representation of the waveforms (see Methods). We analyzed the contrast dependence of the power spectrum of the cVEP only up to the first five harmonics of the fundamental frequency based on an analysis of the cumulative power spectrum (e.g., Jospin et al., 2007), the sum of the power up to and including a specified harmonic, as shown in Figure 8. Figure 8 shows group averaged data over the range of cone contrasts we studied. Most (>80%) of the power of the cVEP was contained in Harmonics 1–5 under all conditions.
Figure 8.
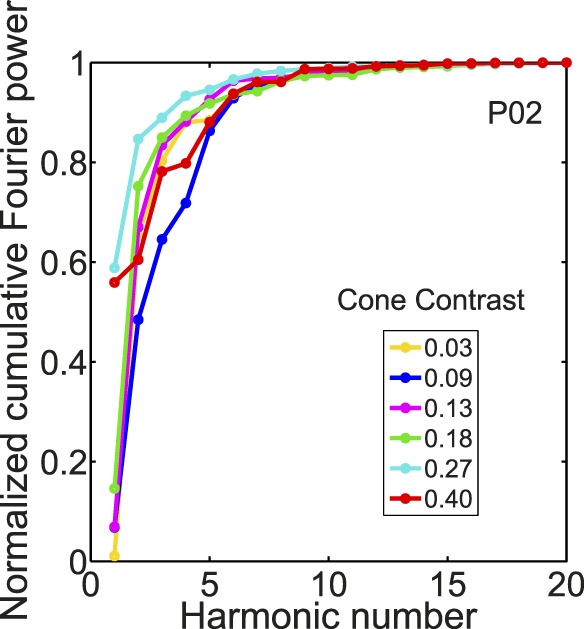
Normalized cumulative Fourier power spectrum for a range of cone contrasts for a typical participant.
The analysis of the Fourier amplitude spectra of the cVEP waveforms demonstrates the profound change in response dynamics with cone contrast. Fourier amplitude spectra are drawn in Figure 9 for one representative participant's data. The Fourier spectra were normalized to 1 at peak amplitude. Figure 9 shows that the spectra change with cone contrast; there is much more power in the higher harmonics at high contrast than at low. This change of spectrum with contrast is a nonlinear effect. In a linear system, the spectrum at higher contrast would have the same shape as at low.
Figure 9.
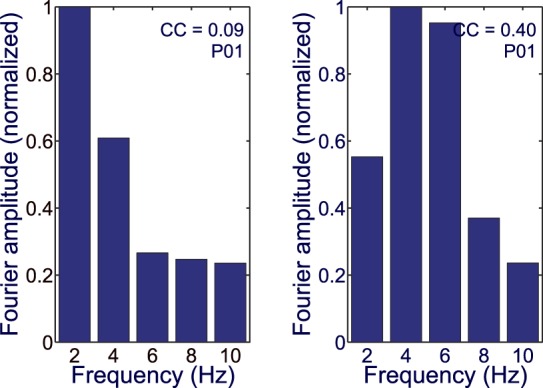
Normalized Fourier amplitude spectrum for two different RMS cone contrasts (0.09 on the left, 0.4 on the right) for a participant.
To quantify the change of the amplitude spectra with cone contrast we devised a spectral shape index = H1/([H2 + H3]/2), that is the ratio of the amplitude of the 2-Hz fundamental Fourier component divided by the average of the amplitudes of the second and third harmonics (i.e., 4 and 6 Hz). Plots of the spectral shape index for one participant and for the population are shown in Figure 10. The spectral shape index declines as cone contrast increases because, as shown in Figure 9, the spectral components of H2 and H3 grow more with contrast than does H1. This is further evidence for the nonlinear dynamics of V1 color-evoked signals in the cVEP.
Figure 10.
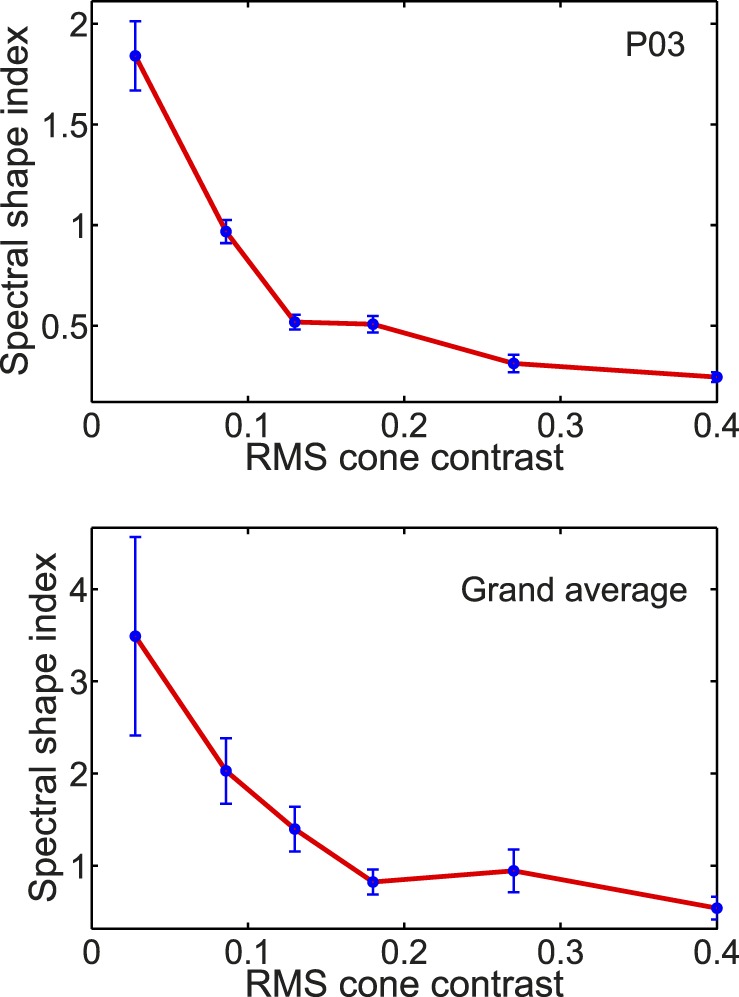
Spectral shape index, defined as the ratio of the first harmonic amplitude to the mean of the second and third harmonic amplitudes, plotted as a function of RMS cone contrast for one participant (top) and averaged over all participants (bottom). In the graph for a single participant (top), error bars were calculated from the Tcirc2 statistic of Victor and Mast (1991). For the grand average (bottom) the error bars represent ±1 SEM.
Fourier analysis also was used to study the dependence of cVEP response power on cone contrast (Figure 11). Figure 11 depicts response power versus cone contrast averaged across all six participants in this study. The upper panel is for summed power across the first five harmonics (2–10 Hz) of the stimulus period. As we reasoned above, the cumulative power spectra (Figure 8) indicated most response power was contained in these five harmonics so the summed power across them should give a good estimate of total response power (Parseval's theorem). What is notable about the summed power (2–10 Hz) is that it rises steeply between 0.03 to 0.09 cone contrast and then levels off so that response power at 0.09 contrast is already 80% as large as the response to the highest cone contrast used, 0.4. In other words, response power grows sublinear with cone contrast. However, we noticed that the power in the third harmonic (i.e., 6 Hz) grew roughly proportionally with cone contrast. This is further evidence of the dynamic nonlinearity of the cVEP, that different Fourier components have different dependences on cone contrast.
Figure 11.
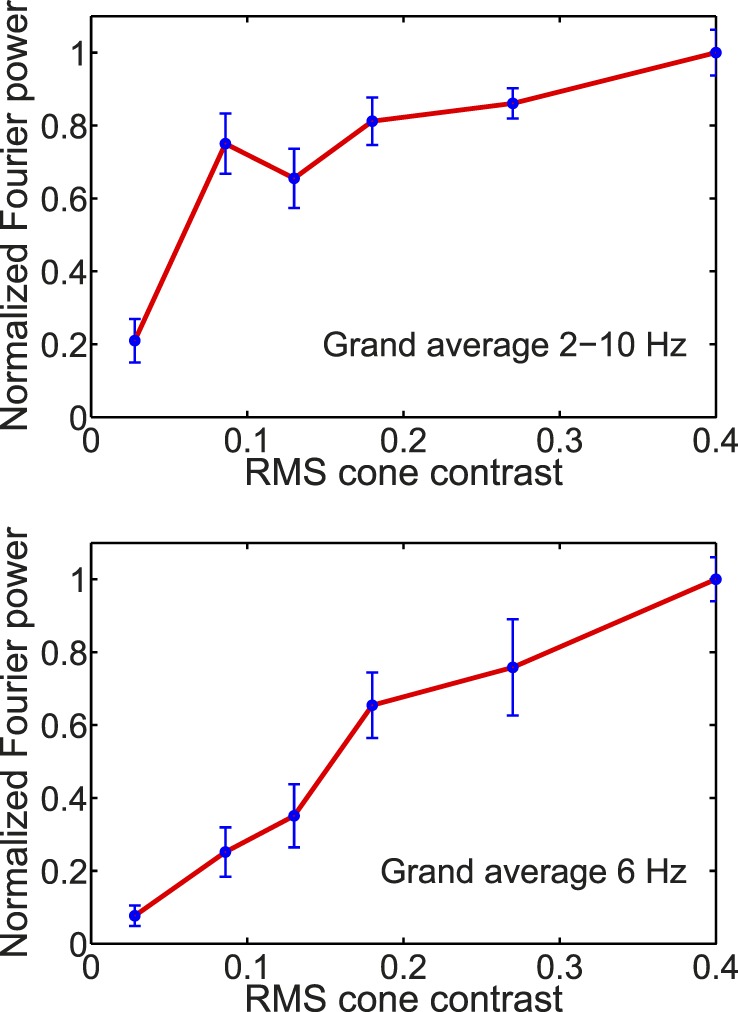
Normalized Fourier power averaged over all participants and plotted as a function of RMS cone contrast. In the top graph, the Fourier power for each participant was summed over the first five Fourier harmonics (2–10 Hz) before normalization and grand averaging. The lower graph shows normalized Fourier power calculated for only the third harmonic (corresponding to 6 Hz) before normalization and grand averaging. Note that the error bars represent ±1 SEM.
Discussion
Population of double-opponent cells as the source of cVEP signals
It is important to discuss the neural origins of the cVEP signal. cVEPs are evoked by equiluminant color modulation; therefore, they must be driven only from subpopulations of cortical neurons that are responsive to color (Schluppeck & Engel, 2002). We found (Figure 4) that for spatial patterns such as checkerboard patterns, the cVEP was localized mostly over posterior occipital cortex, consistent with the hypothesis that the cVEP is generated in V1 cortex (Crognale et al., 2013; Xing et al., 2015). More evidence that the cVEP reflects color-evoked activity in the primary visual cortex is as follows. The cVEP does not vary with attention, a result that strongly suggests it is evoked early in cortical visual processing (Highsmith & Crognale, 2010). Furthermore, normal cVEPs have been recorded in cases of cerebral achromatopsia where color appearance was lost and lesions were observed in ventromedial extrastriate cortex, but V1 responses to color were unaffected by the lesion (Crognale et al., 2013; Victor, Maiese, Shapley, Sidtis, & Gazzaniga, 1989). The combined evidence from source localization, lack of attentional effects, and cerebral achromatopsia indicates that the cVEP is an index of early cortical responses to color (i.e., an index of V1 activity), and the topography supports this. However, the low contrast cVEP indicates more diffuse responses, with activity spreading to lateral posterior cortical areas (Figure 4) at low cone contrast.
As mentioned in the Introduction, cortical color computations are based on the combined activity of two kinds of cortical cone-opponent neurons, single- and double-opponent cells, and also on the cone-nonopponent neurons that respond strongly to achromatic patterns (reviewed in Shapley et al., 2014). Single-opponent cells integrate and double-opponent cells differentiate color signals across visual space. While single-opponent cells respond to large areas of color, double-opponent cells respond to color patterns (Johnson et al., 2001) and color boundaries (Friedman, Zhou, & Heydt, 2003). Double-opponent cells comprise approximately 80% of all color responsive cells in the output layers 2/3 of macaque V1 cortex (Friedman et al., 2003; Johnson et al., 2001) and that may be why they might contribute most to the cVEP signal.
Single- and double-opponent neurons have different spatial frequency responses and this fact can be used to test their contributions to the cVEP. As shown by Schluppeck and Engel (2002), single-opponent neurons not only respond to lower spatial frequencies but also their responses cut off at lower spatial frequencies than those of double-opponent cells. The spatial frequency tuning of double-opponent (and also non-opponent) cells are spatially band pass, like the cVEP. There is a spatial frequency range (1–4 cpd) where double-opponent cells respond and single-opponent neurons respond weakly or not at all. In this range, color stimuli are mainly stimulating double-opponent neurons. The red-gray checkerboard we used had a space-averaged chromaticity. The spatially averaged signal was a red of half the cone-contrast of the checkerboard. Such a stimulus should activate single-opponent cells in V1 (Johnson et al., 2001; Schluppeck & Engel, 2002) but it is known from previous work on the cVEP (Murray et al., 1987; Porciatti & Sartucci, 1996; Rabin et al., 1994; Tobimatsu et al., 1995) that the cVEP amplitude in response to such a low spatial frequency stimulus is very small or absent. Therefore, based on this earlier work, we infer that single-opponent signals were not contributing to the waveforms analyzed in this article and that the nonlinear dynamics observed were affecting signals coming from double-opponent cells.
Locus of nonlinear dynamics in V1
Next we must discuss where in the brain the remarkably large contrast-dependent nonlinearity revealed in Figures 4, 5, 6, 7, 9, and 10 is introduced into the dynamics of color processing.
To appreciate how remarkable are the findings of cortical nonlinearities in V1 color responses, one must compare the cortical data with the linearity of the responses in the parvocellular pathway that provides input to V1 (Lund, 1988). Consider an example from the neurophysiological literature about responses in the parvocellular pathway (Figure 12; data in Benardete & Kaplan, 1999). Plotted in Figure 12 are the spike rate responses of a single macaque retinal ganglion cell of the P-ON L-M+ type. The stimulus was an L-cone isolating grating pattern modulated by a temporal m sequence, and the response was obtained by cross-correlation of the spike train with the m sequence (Reid, Victor, & Shapley, 1997). For this cell, an increase in L-cone stimulation produced a brief reduction in firing rate. The (m sequence) stimulus was effectively very brief with duration ∼15 ms. Therefore, the responses in Figure 12 can be considered to be temporal impulse responses of the retinal network that excited the retinal ganglion cell under study. The stimulus had three different values of cone contrast: 0.0625, 0.125, and 0.25. The responses were graded and approximately proportional to cone contrast. Most important the response waveform was the same shape at the three cone contrasts and simply scaled in amplitude as contrast rose. As the authors of the study noted (Benardete & Kaplan, 1999), this simple scaling behavior is a sign of linearity. This example is shown to establish the well-accepted point that responses of cells in subcortical parvocellular pathway are (approximately) linear with contrast modulation (Benardete & Kaplan, 1999; Kaplan & Shapley, 1986; Lee, Pokorny, Smith, & Kremers, 1994). Furthermore, there is direct evidence from pattern-reversal electroretinogram recordings that P retinal ganglion cells are as linear in humans as in monkeys (Morrone, Fiorentini, Bisti, Porciatti, & Burr, 1994; Morrone, Porciatti, Fiorentini, & Burr, 1994).
Figure 12.
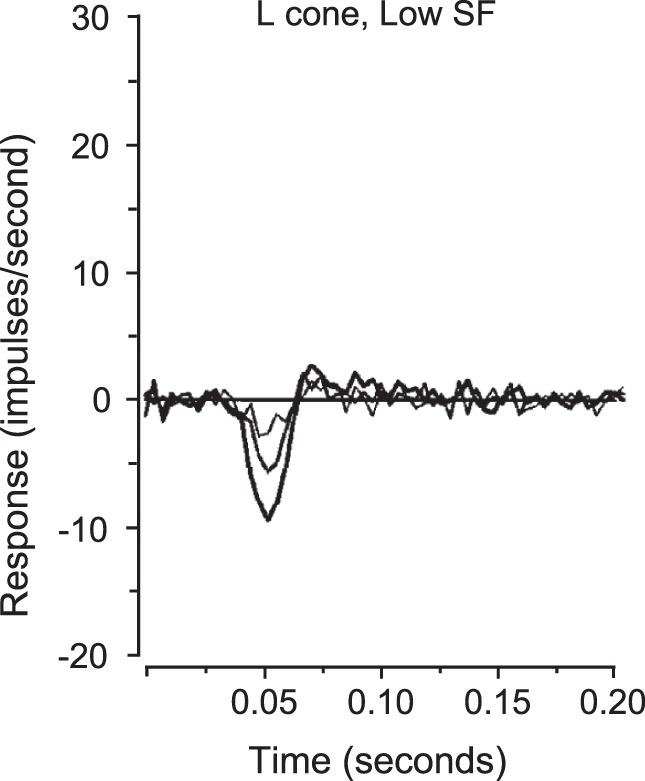
First-order responses of a P ON L-M+ retinal ganglion cell in the macaque monkey retina to chromatic and achromatic gratings at several contrasts. The chromatic gratings used for the responses depicted were L-cone-isolating at 0·145 cpd spatial frequency. The contrasts were 0·0625 (thinnest line), 0·125 and 0·25 (thickest line). As cone contrast increases, the amplitude of the response scales approximately linearly, with no change in the temporal characteristics of the response. Redrawn from Benardete, E. A., & Kaplan, E. (1999). Dynamics of primate P retinal ganglion cells: responses to chromatic and achromatic stimuli. The Journal of Physiology, 519(3), 775–790. Copyright 1999 by John Wiley & Sons, Inc. Adapted with permission.
With the knowledge that in the retina the processing of color-contrast-evoked signals is linear, as in Figure 12, one realizes that the study of the processing of color signals offers a very significant advantage over the study of the nonlinear dynamics of achromatic processing. The retinal and lateral geniculate nucleus sources of achromatic responses, magnocellular pathway neurons, are sped up at higher contrast (Benardete, Kaplan, & Knight, 1992). Speeding up of achromatic responses in the cortex (Carandini et al., 1997) could be at least in part a retinal effect (cf. Freeman, Durand, Kiper, & Carandini, 2002). Since we know that dynamics of response of neurons in the parvocellular subcortical pathway do not vary with contrast, behaving like a linear system, nonlinear effects of color contrast on dynamics must be entirely cortical not retinal if they are driven entirely by parvocellular inputs.
We measured responses from stimuli in the red direction corresponding to the screen's red phosphor and found nonlinear dynamics. Our phase data, and Rabin et al.'s (1994) phase versus contrast data indicate that L-M and S-cone pathways have the same kind of nonlinearity of phase that we measured in the red direction. Therefore, we need to consider the possibility that nonlinearities in the S-cone subcortical pathway may have given rise to the cVEP nonlinearities that we observed. Tailby, Solomon, and Lennie's (2008) measurements in the macaque LGN revealed no phase advance with contrast for pure S-cone input, and the same behavior was observed in the S-potentials of LGN neurons, indicating linear responses with contrast by koniocellular retinal ganglion cells. Therefore, as with the parvocellular subcortical pathway, the dynamics of neurons in the koniocellular subcortical pathway do not vary with contrast, and the nonlinear dynamics observed must still be cortical in nature.
Because it is known that there are nonlinear dynamical effects in the magnocellular pathway, it is worth considering whether or not the cVEP signals we measured were influenced by magnocellular inputs to V1 cortex. For fine pattern stimuli like the ones used in this study, magnocellular cells produce negligibly small responses to equiluminant color patterns (Derrington, Krauskopf, & Lennie, 1984; Lee, Martin, & Valberg, 1989; Shapley & Hawken, 1999). While Lee et al. (1989) reported small nonlinear responses to equiluminant color patterns in magnocellular neurons, they observed these responses to color patterns in magnocellular neurons only for stimulus spots of large area, and indeed ascribed them to nonlinear interactions in the magnocellular receptive field surrounds that could only be driven by large stimuli or very low spatial-frequency patterns. We judge that the nonlinear surround responses of magnocellular neurons would not be evoked by the fine checkerboard patterns that we used as stimuli and thus that the cVEP signals we observed were cortical responses driven by parvocellular and/or koniocellular signals. A further piece of evidence against magnocellular involvement in the cVEP is that a laminar analysis of the color sensitivity in V1 found very weak responses to color patterns in the magno-driven input layer 4C-alpha (Johnson et al., 2001). All of the data cited about magnocellular responses to chromatic stimuli were obtained by microelectrode recordings in the macaque visual pathway. Our reasoning in this discussion is based on the assumption that magnocellular neurons in humans are very similar to those in macaque in terms of their insensitivity to fine color patterns. Support for this assumption comes from many psychophysical experiments on the loss of magnocellular function at equiluminance (reviewed in Livingstone & Hubel, 1988). It would be useful to have more direct support for that assumption.
Another possible way magnocellular signals could corrupt the cVEP signals we measured is by miscalibration of equiluminance in our stimuli. The values of equiluminance used to calibrate our stimuli were based on average normative data while individual equiluminant points differ from the average values. Therefore, what we called equiluminant stimuli for some participants might have contained small amounts of luminance contrast. However, we calculated the amount of luminance contrast possibly introduced by this possible miscalibration and it was small. Furthermore, we have repeated the experiments reported here in other experiments in which we measured equiluminance for each observer individually and obtained the same results on nonlinear dynamics with cone contrast. Therefore, we judge that miscalibration of the equiluminant point had no effect on our inferences about nonlinear dynamics of the cVEP signal.
One might consider the possibility that the nonlinear responses were due to luminance pathway intrusion from chromatic aberration. While there is degradation of color grating patterns by chromatic aberration for patterns with spatial frequencies >4 cpd (Flitcroft, 1989), our dominant frequency was chosen to be well below this limit. The higher spatial frequencies that would be produced by the sharp edges of the checkerboards should not generate responses in the chromatic system because of the high-frequency cut-off of the chromatic system (Rabin et al., 1994). If there had been luminance artifacts we would have expected to see an accompanying reduction in saturation of the checkerboards. However, from pilot tests with 64 × 64, 32 × 32 and 16 × 16 checkerboards we concluded that the 32 × 32 checkerboards are in the range in which these higher harmonics are not producing significant achromatic artifacts.
Lastly, Crognale et al. (1997) proposed an explanation for nonlinear effects with contrast that they observed in cVEPs elicited by ramped sinusoidal modulations along the S and LM axes. They suggested the nonlinearities they observed might be related to the contrast dependence of the interaction between the cVEP and intrinsic cortical rhythms. It is difficult to ascertain whether their observations and interpretation are related to ours because their temporal modulation stimulus was so different. Nevertheless, it is possible that the nonlinear dynamical changes we observed may have been influenced by internal cortical dynamics as suggested by Crognale et al. (1997). However, we do not believe that the cortex's alpha rhythm (8–12 Hz) was involved (as Crognale et al., 1997, conjectured with respect to their data). This is because, while all our participants demonstrated nonlinear speeding up of responses with increasing contrast, only a few exhibited alpha entrainment (though it is clearly apparent for the participant's data in Figure 3). Also, the frequency components that were modified by contrast (Figure 9) were mostly lower than alpha.
Nature of the cortical nonlinearity
The nonlinear dynamics we have described in the cVEP resemble cortical gain control phenomena that have been reported previously for cortical responses to achromatic signals (Albrecht, Geisler, Frazor, & Crane, 2002; Carandini et al., 1997; Ohzawa et al., 1982). Thus it is well known that there are large phase advances and speeding up of time-to-peak of responses of single cortical cells when the contrast of achromatic stimuli is increased (Albrecht et al., 2002; Carandini & Heeger, 2011; Carandini et al., 1997). Such nonlinear dynamics have been ascribed to the action of a cortical contrast gain control, also called normalization. There are different possible models of cortical normalization. Some authors have maintained that normalization is not even a cortical phenomenon but occurs precortically (Freeman et al., 2002), though we remind the reader that such earlier proposals were based on results in the cat cortex and visual pathway where there is no contrast-linear counterpart to the parvocellular input to macaque (and human) V1. Previous authors who discussed cortical mechanisms of normalization emphasized inhibitory mechanisms such as local circuit recurrent inhibition (Carandini & Heeger, 2011; Heeger, 1992). However, it is also possible that modulation of recurrent excitation could be a cortical mechanism for normalization (Carandini & Heeger, 2011; Sato, Haider, Häusser, & Carandini, 2016). As reported by Nauhaus, Busse, Carandini, and Ringach (2009), increasing achromatic contrast reduces the strength of recurrent excitation in cortical circuits by an unknown mechanism, and this could be the kind of mechanism that was observed also by Sato et al. (2016). In short, either recurrent excitation or recurrent inhibition or both in cortical circuits could act to affect response magnitude and also dynamics of visual cortical responses. These mechanisms must also be candidates for explaining the nonlinear dynamics in the cVEP. The double-opponent population could be affected by the same cortical interactions as their neighbors in the cortical circuit, the color-blind nonopponent cells. This would provide a parsimonious explanation for why color contrast produces such large nonlinear dynamic effects; it is color-contrast normalization.
The functional role of the color-dependent dynamics we have observed could be to adapt the cortex to the prevalent visual scene. When there are only weak color contrasts, the cortical network integrates color signals over a longer time. But when color signals are strong, the cortex relaxes back to baseline more quickly to enhance signal resolution and signal differentiation. This is a strategy similar to how the cortex handles achromatic signals. Normalization has been called a canonical computation (Carandini & Heeger, 2011) and our finding of phenomena like normalization in color supports that idea.
Acknowledgments
This research was supported by grant PAC-1555773 from the National Science Foundation. We thank Afsana Amir, Chloe Brittenham, Asmaa Butt, Norine Chan, Aneliya Hanineva, Syed Ali Hassan, Patricia Pehme, Carim-Sanni Ridwan, Yoomin Song, Crismeldy Veloz, and Shaneka Whittick for their help with experiments. We especially thank Peter Schuette who coded the software to produce the stimuli used in this work.
Commercial relationships: none.
Corresponding author: Valerie Nunez.
Email: vnune@hunter.cuny.edu.
Address: Center for Neural Science, New York University, New York, NY, USA.
Contributor Information
Valerie Nunez, Email: vnune@hunter.cuny.edu.
Robert M. Shapley, Email: rms3@nyu.edu, http://www.cns.nyu.edu/corefaculty/Shapley.php.
James Gordon, Email: jgordon@hunter.cuny.edu, http://maxweber.hunter.cuny.edu/~jgordon/.
References
- Albrecht D. G, Geisler W. S, Frazor R. A, Crane A. M. Visual cortex neurons of monkeys and cats: Temporal dynamics of the contrast response function. Journal of Neurophysiology. (2002);88(2):888–913. doi: 10.1152/jn.2002.88.2.888. [DOI] [PubMed] [Google Scholar]
- Benardete E. A, Kaplan E. Dynamics of primate P retinal ganglion cells: Responses to chromatic and achromatic stimuli. The Journal of Physiology. (1999);519(3):775–790. doi: 10.1111/j.1469-7793.1999.0775n.x. [DOI] [PMC free article] [PubMed] [Google Scholar]
- Benardete E. A, Kaplan E, Knight B. W. Contrast gain control in the primate retina: P cells are not X-like, some M cells are. Visual Neuroscience. (1992);8:483–486. doi: 10.1017/s0952523800004995. [DOI] [PubMed] [Google Scholar]
- Brainard D. H. The Psychophysics Toolbox. Spatial Vision. (1997);10:433–436. [PubMed] [Google Scholar]
- Brainard D. H. Color constancy. In: Chalupa L. M, Werner J. S, editors. The visual neurosciences. Cambridge, MA: MIT Press; (2004). pp. 948–961. (Eds.) [Google Scholar]
- Carandini M, Heeger D. J. Normalization as a canonical neural computation. Nature Reviews Neuroscience. (2011);13(1):51–62. doi: 10.1038/nrn3136. [DOI] [PMC free article] [PubMed] [Google Scholar]
- Carandini M, Heeger D. J, Movshon J. A. Linearity and normalization in simple cells of the macaque primary visual cortex. Journal of Neuroscience. (1997);17(21):8621–8644. doi: 10.1523/JNEUROSCI.17-21-08621.1997. [DOI] [PMC free article] [PubMed] [Google Scholar]
- Conway B. R, Chatterjee S, Field G. D, Horwitz G. D, Johnson E. N, Koida K, Mancuso K. Advances in color science: from retina to behavior. Journal of Neuroscience. (2010);30(45):14955–14963. doi: 10.1523/JNEUROSCI.4348-10.2010. [DOI] [PMC free article] [PubMed] [Google Scholar]
- Conway B. R, Moeller S, Tsao D. Y. Specialized color modules in macaque extrastriate cortex. Neuron. (2007);56(3):560–573. doi: 10.1016/j.neuron.2007.10.008. [DOI] [PMC free article] [PubMed] [Google Scholar]
- Crognale M. A. Development, maturation, and aging of chromatic visual pathways: VEP results. Journal of Vision. (2002);2(6):438–450.:2. doi: 10.1167/2.6.2. doi: 10.1167/2.6.2 PubMed] [ Article. [DOI] [PubMed] [Google Scholar]
- Crognale M. A, Duncan C. S, Shoenhard H, Peterson D. J, Berryhill M. E. The locus of color sensation: Cortical color loss and the chromatic visual evoked potential. Journal of Vision. (2013);13(10):1–11.:15. doi: 10.1167/13.10.15. doi: 10.1167/13.10.15 PubMed] [ Article. [DOI] [PMC free article] [PubMed] [Google Scholar]
- Crognale M. A, Switkes E, Adams A. J. Temporal response characteristics of the spatiochromatic visual evoked potential: Nonlinearities and departures from psychophysics. Journal of the Optical Society of America A. (1997);14(10):2595–2607. doi: 10.1364/josaa.14.002595. [DOI] [PubMed] [Google Scholar]
- Crognale M. A, Switkes E, Rabin J, Schneck M. E, Hægerström-Portnoy G, Adams A. J. Application of the spatiochromatic visual evoked potential to detection of congenital and acquired color-vision deficiencies. Journal of the Optical Society of America A. (1993);10(8):1818–1825. doi: 10.1364/josaa.10.001818. [DOI] [PubMed] [Google Scholar]
- Derrington A. M, Krauskopf J, Lennie P. Chromatic mechanisms in lateral geniculate nucleus of macaque. The Journal of Physiology. (1984);357(1):241–265. doi: 10.1113/jphysiol.1984.sp015499. [DOI] [PMC free article] [PubMed] [Google Scholar]
- Flitcroft D. I. The interactions between chromatic aberration, defocus and stimulus chromaticity: Implications for visual physiology and colorimetry. Vision Research. (1989);29(3):349–360. doi: 10.1016/0042-6989(89)90083-7. [DOI] [PubMed] [Google Scholar]
- Freeman T. C, Durand S, Kiper D. C, Carandini M. Suppression without inhibition in visual cortex. Neuron. (2002);35(4):759–771. doi: 10.1016/s0896-6273(02)00819-x. [DOI] [PubMed] [Google Scholar]
- Friedman H. S, Zhou H, Heydt R. The coding of uniform colour figures in monkey visual cortex. The Journal of Physiology. (2003);548(2):593–613. doi: 10.1113/jphysiol.2002.033555. [DOI] [PMC free article] [PubMed] [Google Scholar]
- Gomes B. D, Souza G. S, Saito C. A, da Silva Filho M, Rodrigues A. R, Ventura D. F, Silveira L. C. L. Cone contrast influence on components of the pattern onset/offset VECP. Ophthalmic and Physiological Optics. (2010);30(5):518–524. doi: 10.1111/j.1475-1313.2010.00751.x. [DOI] [PubMed] [Google Scholar]
- Gordon J, Abramov I, Chan H. Describing color appearance: hue and saturation scaling. Attention, Perception, & Psychophysics. (1994);56(1):27–41. doi: 10.3758/bf03211688. [DOI] [PubMed] [Google Scholar]
- Harada T, Goda N, Ogawa T, Ito M, Toyoda H, Sadato N, Komatsu H. Distribution of colour-selective activity in the monkey inferior temporal cortex revealed by functional magnetic resonance imaging. European Journal of Neuroscience. (2009);30(10):1960–1970. doi: 10.1111/j.1460-9568.2009.06995.x. [DOI] [PubMed] [Google Scholar]
- Heeger D. J. Normalization of cell responses in cat striate cortex. Visual Neuroscience. (1992);9(2):181–197. doi: 10.1017/s0952523800009640. [DOI] [PubMed] [Google Scholar]
- Highsmith J, Crognale M. A. Attentional shifts have little effect on the waveform of the chromatic onset VEP. Ophthalmic and Physiological Optics. (2010);30(5):525–533. doi: 10.1111/j.1475-1313.2010.00747.x. [DOI] [PubMed] [Google Scholar]
- Hurlbert A, Wolf K. Color contrast: A contributory mechanism to color constancy. Progress in Brain Research. (2004);144:145–160. doi: 10.1016/s0079-6123(03)14410-x. [DOI] [PubMed] [Google Scholar]
- Jansen M, Li X, Lashgari R, Kremkow J, Bereshpolova Y, Swadlow H. A, Alonso J. M. Chromatic and achromatic spatial resolution of local field potentials in awake cortex. Cerebral Cortex. (2014);25(10):3877–3893. doi: 10.1093/cercor/bhu270. [DOI] [PMC free article] [PubMed] [Google Scholar]
- Johnson E. N, Hawken M. J, Shapley R. The spatial transformation of color in the primary visual cortex of the macaque monkey. Nature Neuroscience. (2001);4(4):409–416. doi: 10.1038/86061. [DOI] [PubMed] [Google Scholar]
- Jospin M, Caminal P, Jensen E. W, Vallverdú M, Struys M. M, Vereecke H. E, Kaplan D. T. Conference Proceedings: Annual International Conference of the IEEE in Engineering in Medicine and Biology Society. New York: IEEE; (2007. August) Depth of anesthesia index using cumulative power spectrum; pp. 15–18. [DOI] [PubMed] [Google Scholar]
- Kaplan E, Shapley R. The primate retina contains two types of ganglion cells, with high and low contrast sensitivity. Proceedings of the National Academy of Science, USA. (1986);83:2755–2757. doi: 10.1073/pnas.83.8.2755. [DOI] [PMC free article] [PubMed] [Google Scholar]
- Kleiner M, Brainard D, Pelli D, Ingling A, Murray R, Broussard C. What's new in Psychtoolbox-3. Perception. (2007);36(1):1–16. [Google Scholar]
- Komatsu H. Mechanisms of central color vision. Current Opinion in Neurobiology. (1998);8(4):503–508. doi: 10.1016/s0959-4388(98)80038-x. [DOI] [PubMed] [Google Scholar]
- Lee B. B, Martin P. R, Valberg A. Nonlinear summation of M-and L-cone inputs to phasic retinal ganglion cells of the macaque. Journal of Neuroscience. (1989);9(4):1433–1442. doi: 10.1523/JNEUROSCI.09-04-01433.1989. [DOI] [PMC free article] [PubMed] [Google Scholar]
- Lee B. B, Pokorny J, Smith V. C, Kremers J. Responses to pulses and sinusoids in macaque ganglion cells. Vision Research. (1994);34(23):3081–3096. doi: 10.1016/0042-6989(94)90074-4. [DOI] [PubMed] [Google Scholar]
- Lennie P, Krauskopf J, Sclar G. Chromatic mechanisms in striate cortex of macaque. Journal of Neuroscience. (1990);10(2):649–669. doi: 10.1523/JNEUROSCI.10-02-00649.1990. [DOI] [PMC free article] [PubMed] [Google Scholar]
- Livingstone M, Hubel D. Segregation of form, color, movement, and depth- Anatomy, physiology, and perception. Science. (1988);240(4853):740–749. doi: 10.1126/science.3283936. [DOI] [PubMed] [Google Scholar]
- Lund J. S. Anatomical organization of macaque monkey striate visual cortex. Annual Review of Neuroscience. (1988);11(1):253–288. doi: 10.1146/annurev.ne.11.030188.001345. [DOI] [PubMed] [Google Scholar]
- Morrone C, Fiorentini A, Bisti S, Porciatti V, Burr D. C. Pattern-reversal electroretinogram in response to chromatic stimuli: II Monkey. Visual Neuroscience. (1994);11(05):873–884. doi: 10.1017/s0952523800003837. [DOI] [PubMed] [Google Scholar]
- Morrone C, Porciatti V, Fiorentini A, Burr D. C. Pattern-reversal electroretinogram in response to chromatic stimuli: I Humans. Visual Neuroscience. (1994);11(05):861–871. doi: 10.1017/s0952523800003825. [DOI] [PubMed] [Google Scholar]
- Murray I. J, Parry N. R. A, Carden D, Kulikowski J. J. Human visual evoked-potentials to chromatic and achromatic gratings. Clinical Vision Sciences. (1987);1(3):231–244. [Google Scholar]
- Nauhaus I, Busse L, Carandini M, Ringach D. L. Stimulus contrast modulates functional connectivity in visual cortex. Nature Neuroscience. (2009);12(1):70–76. doi: 10.1038/nn.2232. [DOI] [PMC free article] [PubMed] [Google Scholar]
- Ohzawa I, Sclar G, Freeman R. D. Contrast gain control in the cat visual cortex. Nature. (1982);298(5871):266–268. doi: 10.1038/298266a0. [DOI] [PubMed] [Google Scholar]
- Oostenveld R, Fries P, Maris E, Schoffelen J. M. FieldTrip: Open source software for advanced analysis of MEG, EEG, and invasive electrophysiological data. Computational Intelligence and Neuroscience. (2011);2011:156869. doi: 10.1155/2011/156869. [DOI] [PMC free article] [PubMed] [Google Scholar]
- Oostenveld R, Praamstra P. The five percent electrode system for high-resolution EEG and ERP measurements. Clinical Neurophysiology. (2001);112(4):713–719. doi: 10.1016/s1388-2457(00)00527-7. [DOI] [PubMed] [Google Scholar]
- Pelli D. G. The VideoToolbox software for visual psychophysics: Transforming numbers into movies. Spatial Vision. (1997);10(4):437–442. [PubMed] [Google Scholar]
- Porciatti V, Sartucci F. Retinal and cortical evoked responses to chromatic contrast stimuli: Specific losses in both eyes of patients with multiple sclerosis and unilateral optic neuritis. Brain. (1996);119(3):723–740. doi: 10.1093/brain/119.3.723. [DOI] [PubMed] [Google Scholar]
- Rabin J, Switkes E, Crognale M, Schneck M. E, Adams A. J. Visual evoked potentials in three-dimensional color space: Correlates of spatio-chromatic processing. Vision Research. (1994);34(20):2657–2671. doi: 10.1016/0042-6989(94)90222-4. [DOI] [PubMed] [Google Scholar]
- Reid R. C, Victor J. D, Shapley R. M. The use of m-sequences in the analysis of visual neurons: linear receptive field properties. Visual Neuroscience. (1997);14(06):1015–1027. doi: 10.1017/s0952523800011743. [DOI] [PubMed] [Google Scholar]
- Sato T. K, Haider B, Häusser M, Carandini M. An excitatory basis for divisive normalization in visual cortex. Nature Neuroscience. (2016);19(4):568–570. doi: 10.1038/nn.4249. [DOI] [PMC free article] [PubMed] [Google Scholar]
- Scarfe P. Psychtoolbox Demos. (n.d.)2016 Retrieved July 15. from http://peterscarfe.com/ptbtutorials.html.
- Schluppeck D, Engel S. A. Color opponent neurons in V1: A review and model reconciling results from imaging and single-unit recording. Journal of Vision. (2002);2(6):480–492.:5. doi: 10.1167/2.6.5. doi: 10.1167/2.6.5 PubMed] [ Article. [DOI] [PubMed] [Google Scholar]
- Shapley R. M, Hawken M. J. Parallel retinocortical channels and luminance. In: Gegenfurtner K, Sharpe L, editors. Color vision: From genes to perception. Cambridge, UK: Cambridge University Press; (1999). pp. 221–234. (Eds.) [Google Scholar]
- Shapley R. M, Hawken M. J, Johnson E. B. Color in primary visual cortex. In: Werner J. S, Chalupa L. M, editors. The new visual neurosciences. Cambridge, MA: MIT Press; (2014). pp. 569–586. (Eds.) [Google Scholar]
- Souza G. S, Gomes B. D, Lacerda E. M. C, Saito C. A, da Silva Filho M, Silveira L. C. L. Amplitude of the transient visual evoked potential (tVEP) as a function of achromatic and chromatic contrast: Contribution of different visual pathways. Visual Neuroscience. (2008);25(3):317–325. doi: 10.1017/S0952523808080243. [DOI] [PubMed] [Google Scholar]
- Tailby C, Solomon S. G, Lennie P. Functional asymmetries in visual pathways carrying S-cone signals in macaque. Journal of Neuroscience. (2008);28(15):4078–4087. doi: 10.1523/JNEUROSCI.5338-07.2008. [DOI] [PMC free article] [PubMed] [Google Scholar]
- Thorell L. G, de Valois R. L, Albrecht D. G. Spatial mapping of monkey VI cells with pure color and luminance stimuli. Vision Research. (1984);24(7):751–769. doi: 10.1016/0042-6989(84)90216-5. [DOI] [PubMed] [Google Scholar]
- Tobimatsu S, Tomoda H, Kato M. Parvocellular and magnocellular contributions to visual evoked potentials in humans: Stimulation with chromatic and achromatic gratings and apparent motion. Journal of the Neurological Sciences. (1995);134(1):73–82. doi: 10.1016/0022-510x(95)00222-x. [DOI] [PubMed] [Google Scholar]
- Victor J. D, Maiese K, Shapley R, Sidtis J, Gazzaniga M. S. Acquired central dyschromatopsia: Analysis of a case with preservation of color discrimination. Clinical Vision Sciences. (1989);4:183–196. [Google Scholar]
- Victor J. D, Mast J. A new statistic for steady-state evoked potentials. Electroencephalography and Clinical Neurophysiology. (1991);78(5):378–388. doi: 10.1016/0013-4694(91)90099-p. [DOI] [PubMed] [Google Scholar]
- Wandell B. A, Winawer J. Imaging retinotopic maps in the human brain. Vision Research. (2011);51(7):718–737. doi: 10.1016/j.visres.2010.08.004. [DOI] [PMC free article] [PubMed] [Google Scholar]
- Wyszecki G, Stiles W. S. Color science: Concepts and methods, quantitative data and formulae. New York: Wiley; (1982). [Google Scholar]
- Xing D, Ouni A, Chen S, Sahmoud H, Gordon J, Shapley R. Brightness–color interactions in human early visual cortex. Journal of Neuroscience. (2015);35(5):2226–2232. doi: 10.1523/JNEUROSCI.3740-14.2015. [DOI] [PMC free article] [PubMed] [Google Scholar]
- Zeki S. Colour coding in the cerebral cortex: The reaction of cells in monkey visual cortex to wavelengths and colours. Neuroscience. (1983);9(4):741–765. doi: 10.1016/0306-4522(83)90265-8. [DOI] [PubMed] [Google Scholar]


